 accuracy
Illustrate the concept of accuracy: the fraction of data points whose predicted label matches the true label.
 artificial neural network (ANN)
Numerical companion to the glossary entry 'ann' (artificial neural network).
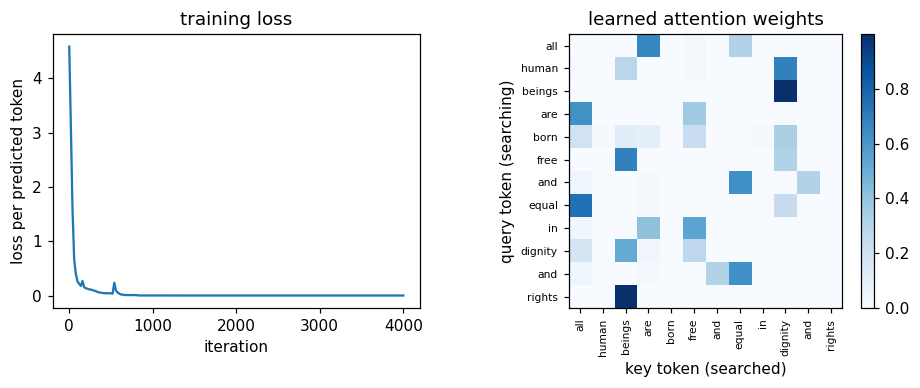 attention
Illustrate attention as a learned *associative memory*.
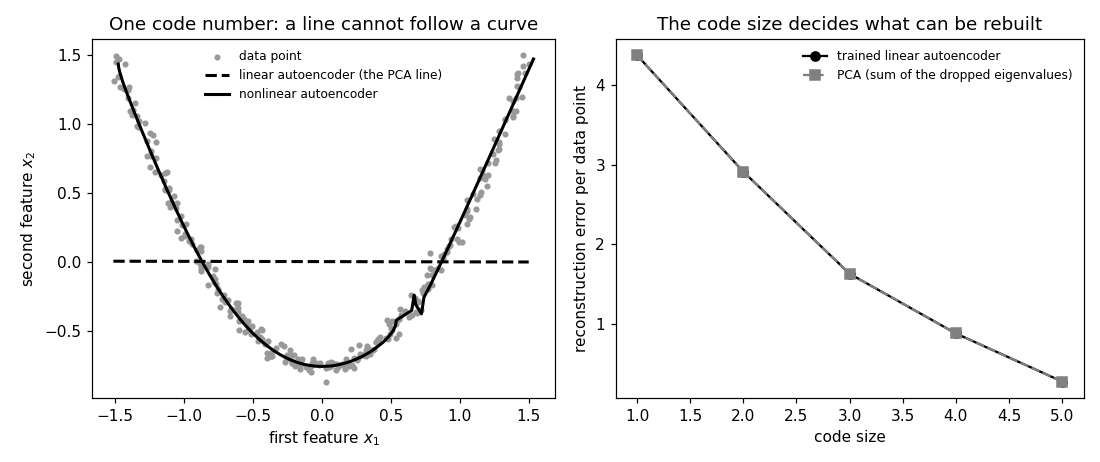 autoencoder
Numerical companion to the glossary entry 'autoencoder'.
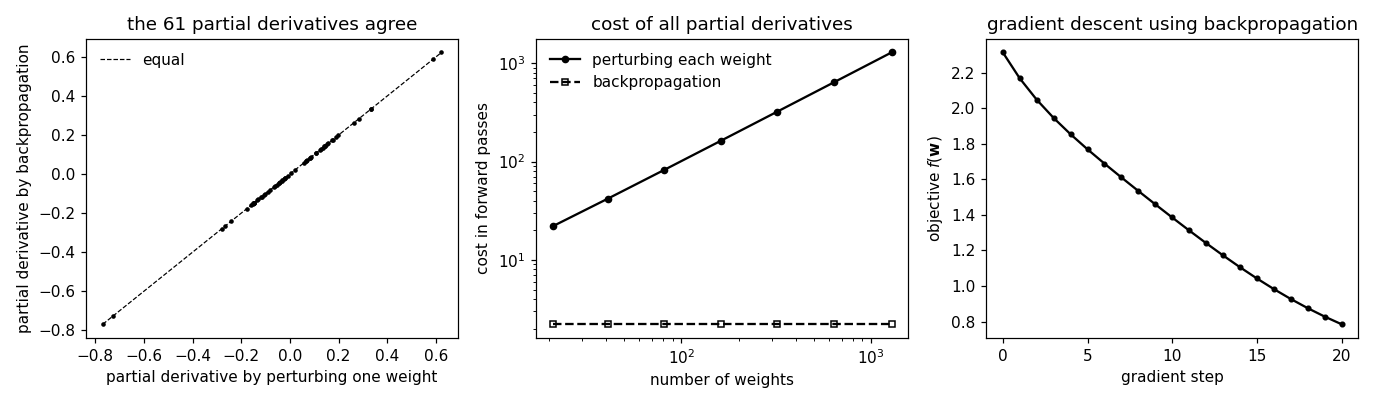 backpropagation
Backs the entry's claims on a small artificial neural network (ANN) with one hidden layer, the network of the entry's figure: backpropagation delivers the partial derivative of the loss with respect to every weight in one forward and one backward pass, the result agrees with perturbing each weight separately, and the cost of the latter grows with the number of weights while the cost of backpropagation stays a small multiple of one forward pass.
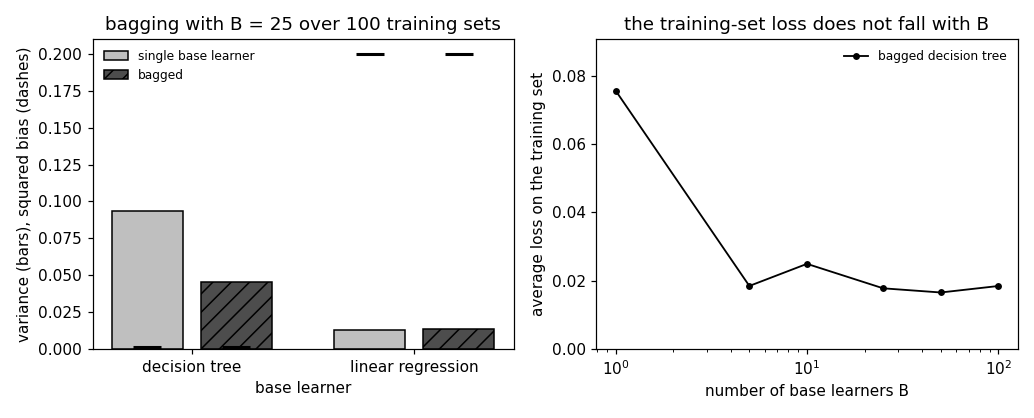 bagging
Backs the entry's claims with numbers: a decision tree grown until it reproduces every label changes its predictions noticeably when a handful of training points are replaced, while a straight line fitted to the same points barely does; bagging reduces the variance of the tree's predictions while changing its squared bias by far less; it does little for the straight line; the variance of an average of M bagged trees follows rho sigma^2 + (1 - rho) sigma^2 / M on training sets it was not fitted to; and two resamples of one training set share about 40% of its data points, which is where rho comes from.
 baseline
Numerical companion to the glossary entry 'baseline'.
 binary classification
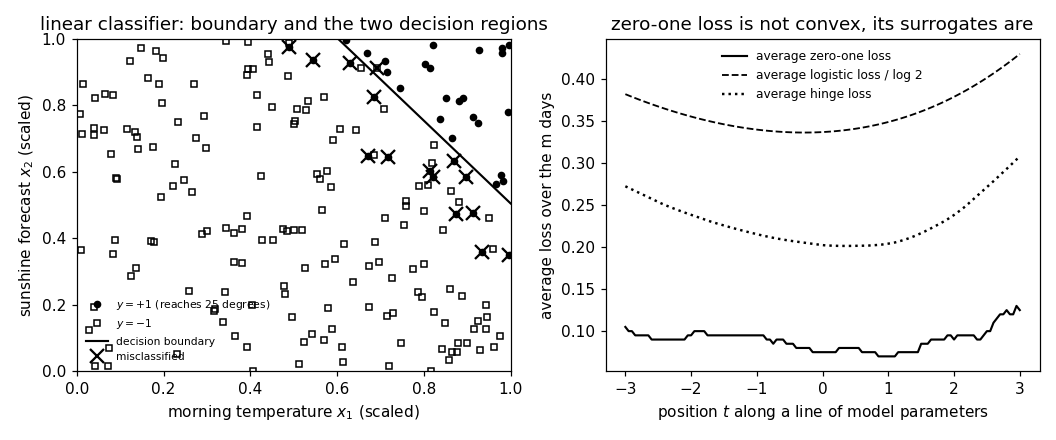
Backs the entry's claims numerically: the average zero-one loss of a classifier is 1 minus its accuracy; the decision boundary of a linear classifier is a straight line that cuts the feature space into the two decision regions; the zero-one loss is not convex in the model parameters, while the logistic loss (divided by log 2) and the hinge loss are convex and upper bound it; on imbalanced data the constant answer already has a high accuracy, so the confusion matrix with precision and recall says more than the accuracy alone.
 boosting
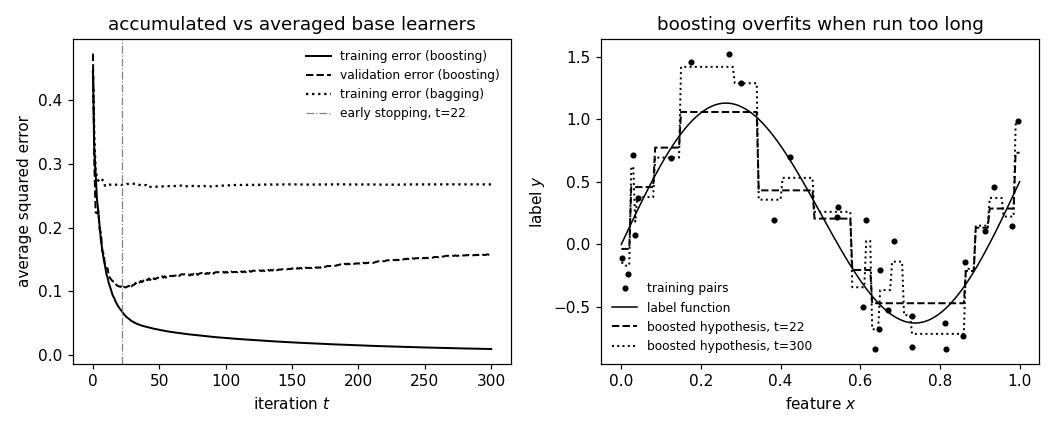
Runs boosting with the squared error loss on a task with one feature and a real-valued label and checks the entry's claims numerically: each base learner is fit to the residuals, which are the negative gradient of the training error with respect to the current predictions, so each iteration lowers the training error; with enough iterations the training error becomes arbitrarily small while the validation error eventually rises, so the number of iterations is a hyperparameter chosen by early stopping; and accumulating base learners (boosting) differs from averaging them (bagging).
 bootstrap
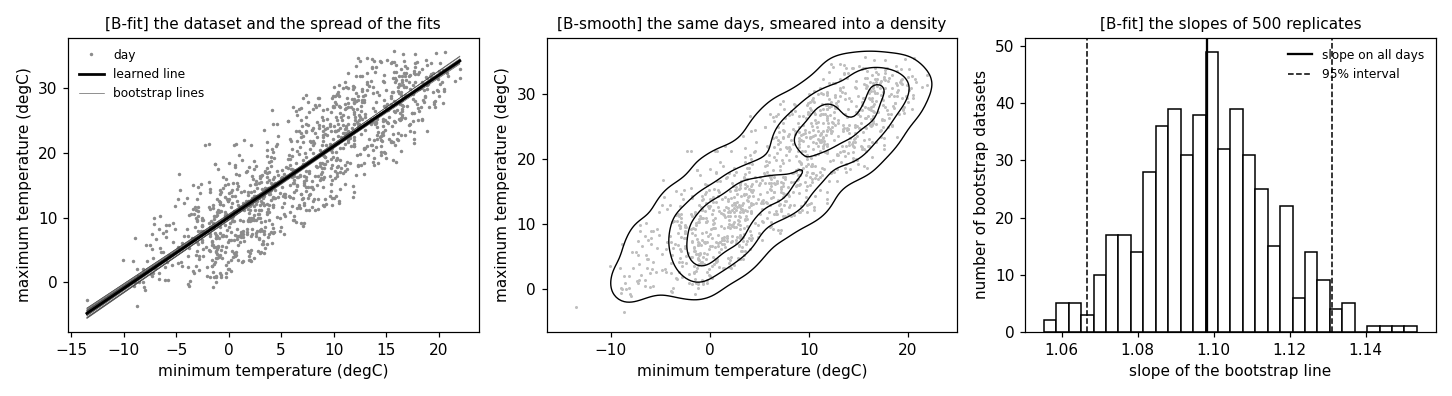
Three years of daily minimum and maximum temperature at Krems an der Donau stand in for the dataset D.
 classification
The entry's first figure is produced here from data rather than drawn by hand: a training set of data points with known labels and two features, the linear classifier learned from it, and the two decision regions its decision boundary cuts the feature space into.
 clustering
Numerical companion to the glossary entry 'clustering'.
 concept activation vector (CAV)
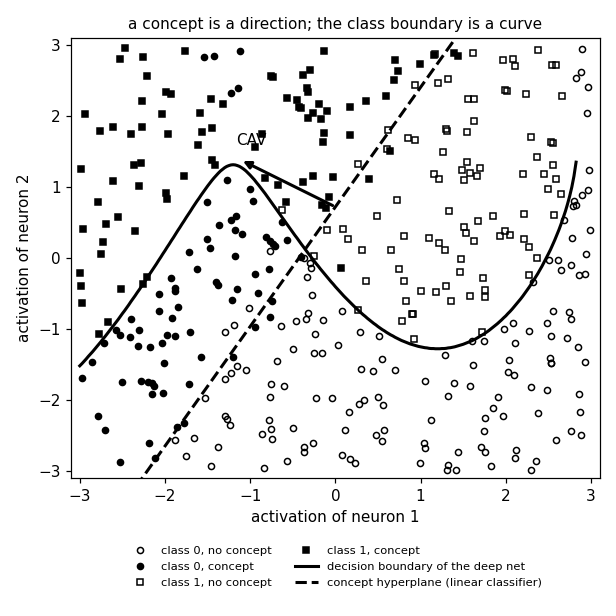
A CAV is fitted the way the entry describes it, on real data.
 confusion matrix
Numerical companion to the glossary entry 'cm' (confusion matrix).
 convex
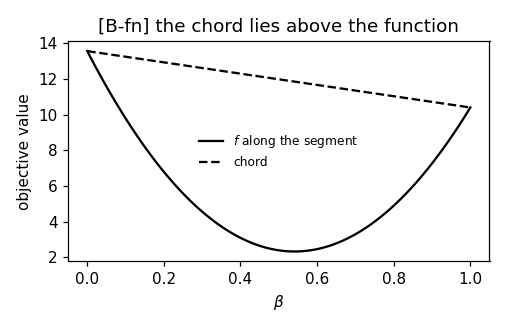
Verifies the entry's two definitions and its ML claim on concrete objects: segment membership for a convex set, the chord inequality and epigraph convexity for the average squared error loss of linear regression, and the local-equals-global-minimum property via gradient descent from many random initializations.
 covariance matrix
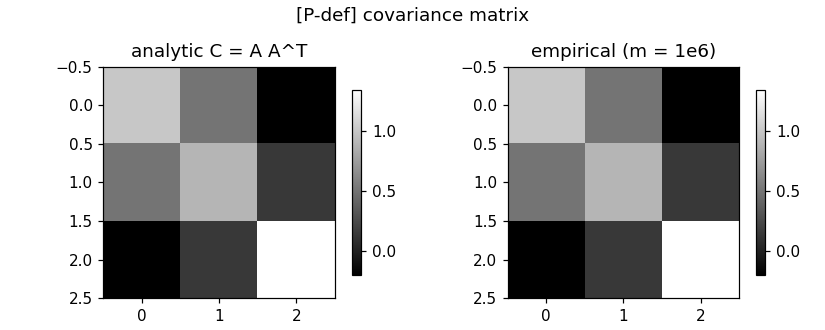
One block per paragraph of the entry (marked [P...]): each block verifies numerically what the corresponding statement asserts.
 data
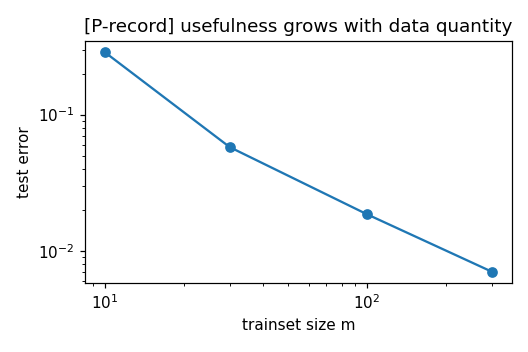
One block per paragraph of the entry (marked [P...]): each block verifies numerically what the corresponding statement asserts.
 data augmentation
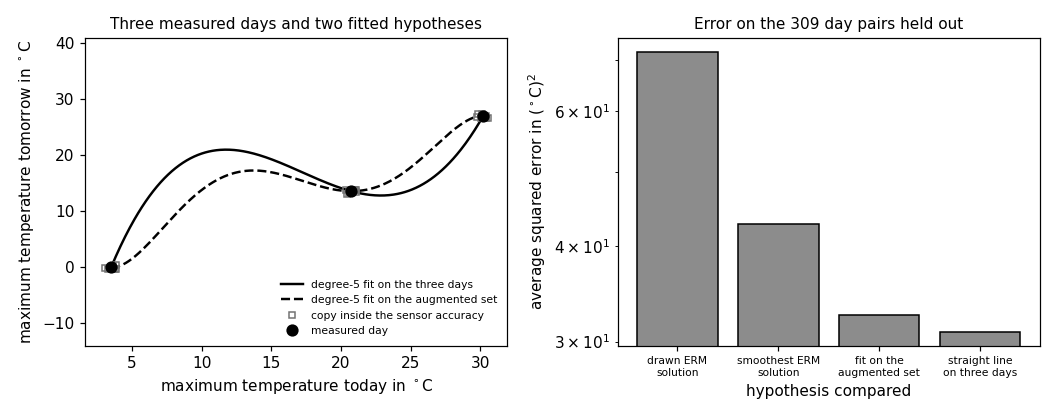
Numerical companion to the glossary entry 'dataaug'.
 data imputation
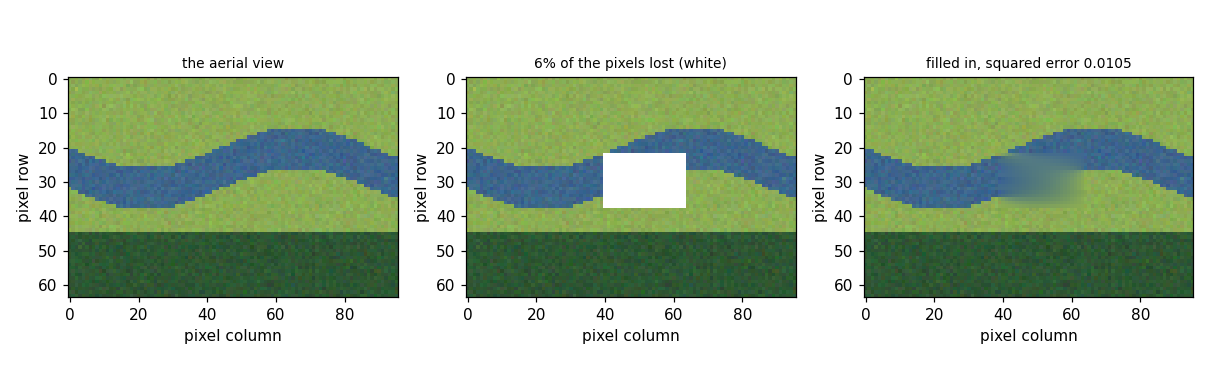
The entry's construction, carried out: an aerial photograph loses a rectangular region, and the lost pixels are filled in by learning to predict the RGB values of a pixel from the RGB values of its neighbors.
 data leakage
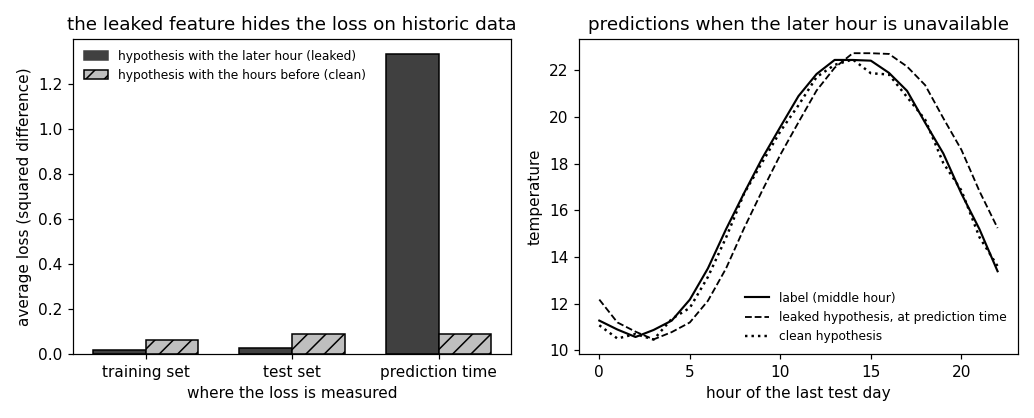
Reproduces the entry's example: an hourly temperature sequence, each data point a sliding window of three consecutive hours, the label the temperature of the middle hour.
 data point
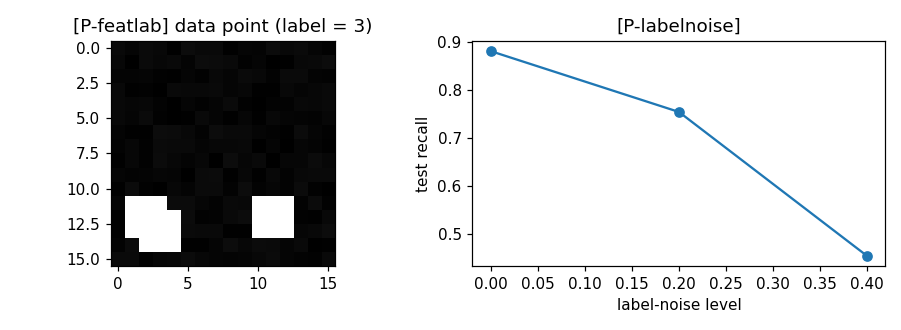
One block per paragraph of the entry (marked [P...]): each block verifies numerically what the corresponding statement asserts.
 dataset
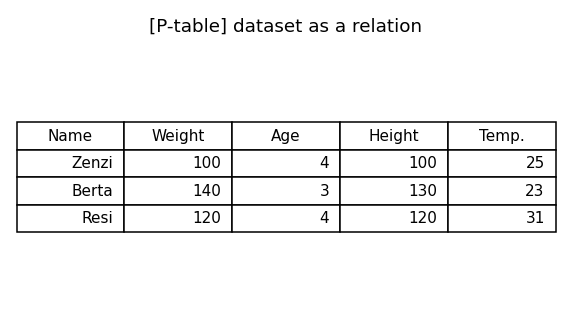
One block per paragraph of the entry (marked [P...]): each block verifies numerically what the corresponding statement asserts.
 decision tree
A single depth-2 regression tree is trained, in the CART fashion the entry describes, on actual weather measurements from the open data server of the Finnish Meteorological Institute (FMI): the 366 days of 2024 at the Helsinki Kaisaniemi station, with the daily minimum temperature as the feature and the daily maximum temperature as the label.
 dimensionality reduction
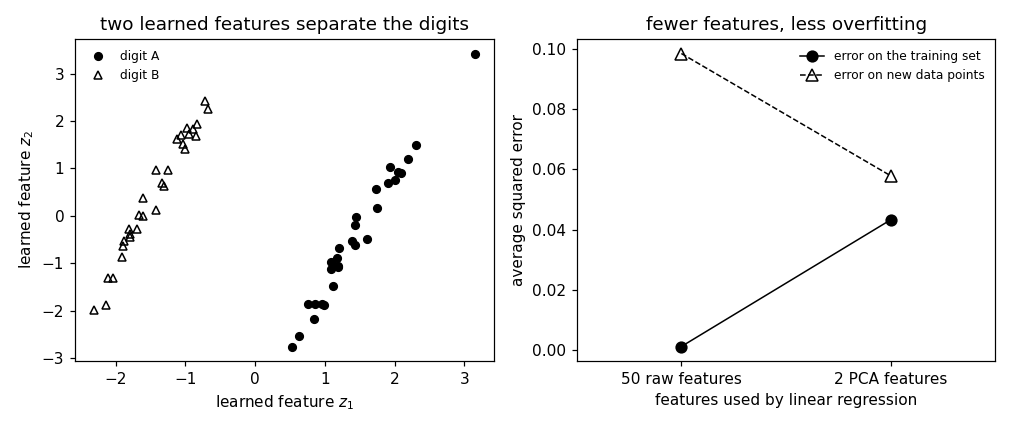
Checks the three benefits the entry attributes to using a shorter feature vector, on the patches of a real photograph: the statistical benefit (less overfitting of linear regression on the learned features than on the raw ones), the computational benefit (the matrix that linear regression inverts shrinks with the number of features), and visualization (two learned features place patches that look alike near each other).
 distribution shift
Numerical companion to the glossary entry 'distshift' (distribution shift).
 eigenvalue
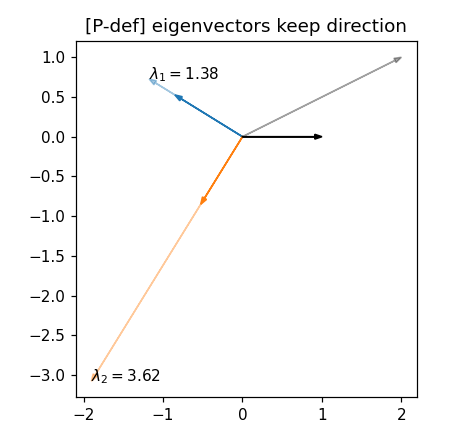
One block per paragraph of the entry (marked [P...]): each block verifies numerically what the corresponding statement asserts.
 eigenvalue decomposition (EVD)
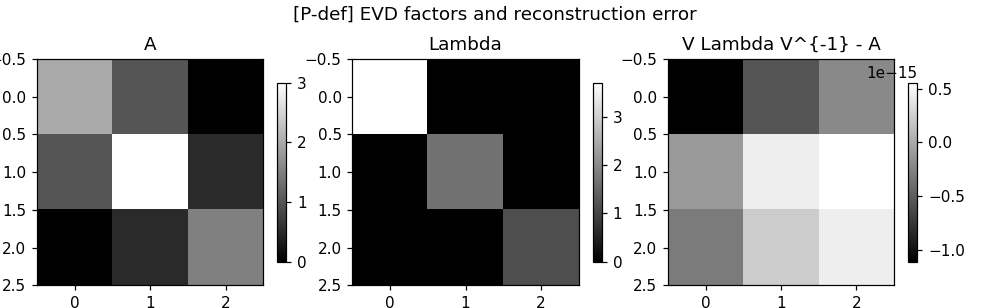
One block per paragraph of the entry (marked [P...]): each block verifies numerically what the corresponding statement asserts.
 empirical risk minimization (ERM)
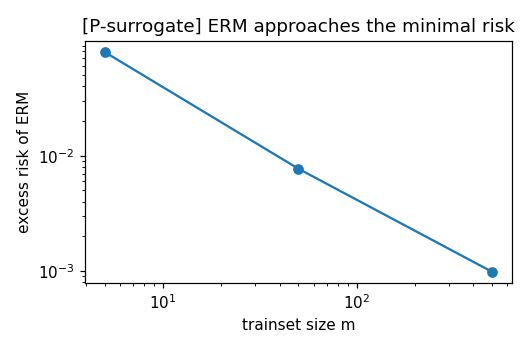
One block per paragraph of the entry (marked [P...]): each block verifies numerically what the corresponding statement asserts.
 ensemble
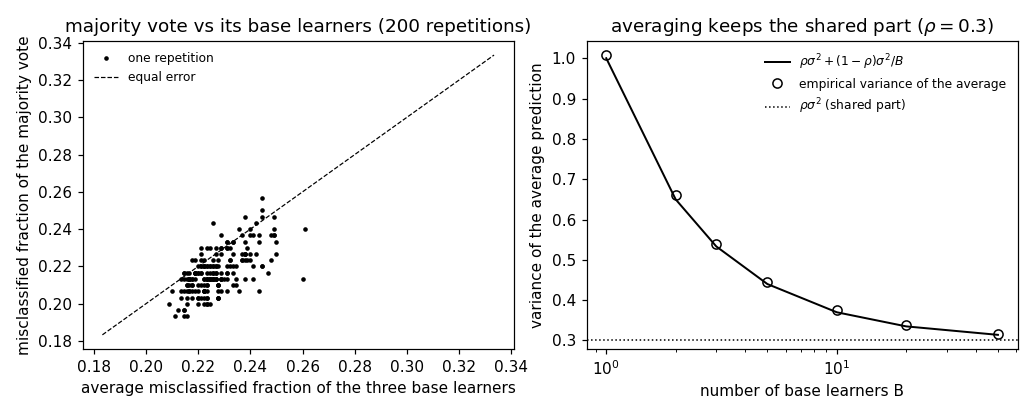
Three different ML methods are fit to the same task: predict the maximum temperature of a day at the GeoSphere Austria station Krems an der Donau from the minimum temperature of that same day, over the 366 days of 2020.
 expectation–maximization (EM)
Numerical companion to the glossary entry 'em' (expectation-maximization).
 explainability
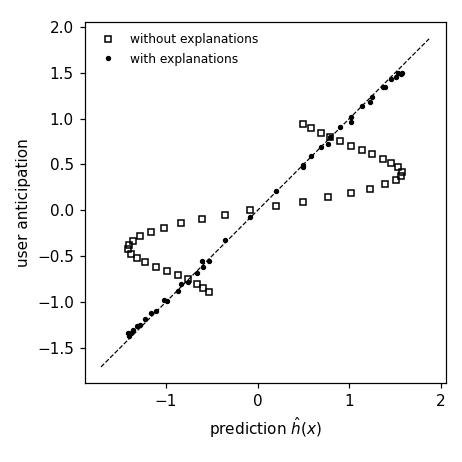
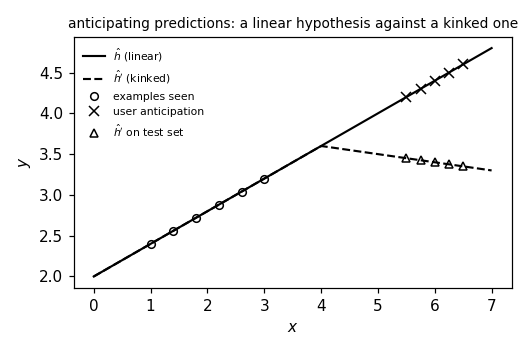
Quantifies the (subjective) explainability of a trained hypothesis for a simulated user, via the two measures discussed in the entry: the deviation between the user-anticipated and the actual predictions on a test set, and the empirical conditional entropy of the predictions given the user's anticipations.
 explainable artificial intelligence (XAI)
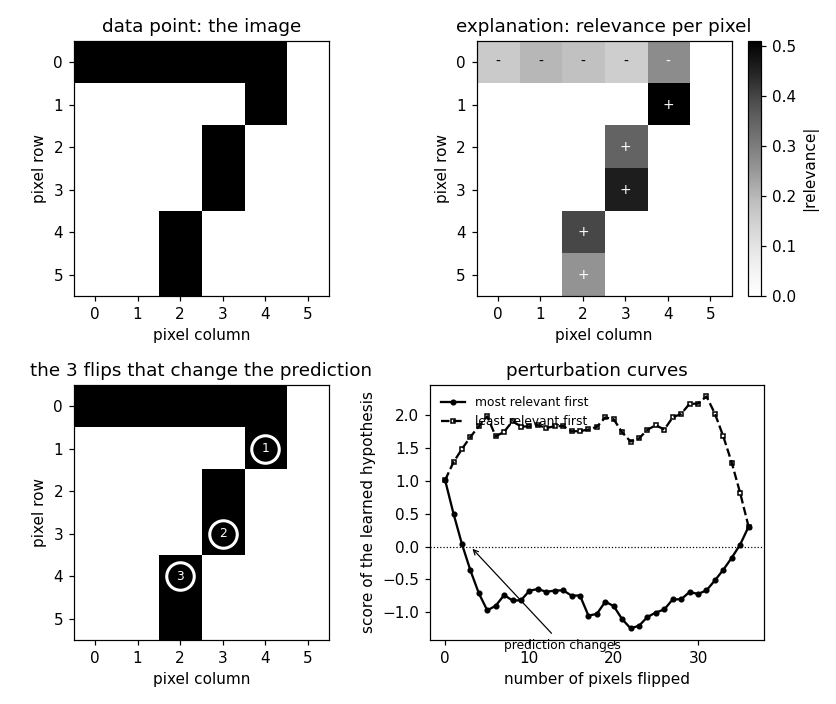
Backs the entry's method claims with exact computations on the very hypothesis drawn in the entry's counterfactual figure, h(x) = 1.2 + 2.2 / (1 + exp(-1.8 (x - 3.5))) with decision threshold 2.6 and data point x0 = 2.2: LIME's local linear approximation, the counterfactual as the smallest prediction-altering change, and the additive (efficiency) property of SHAP.
 explanation
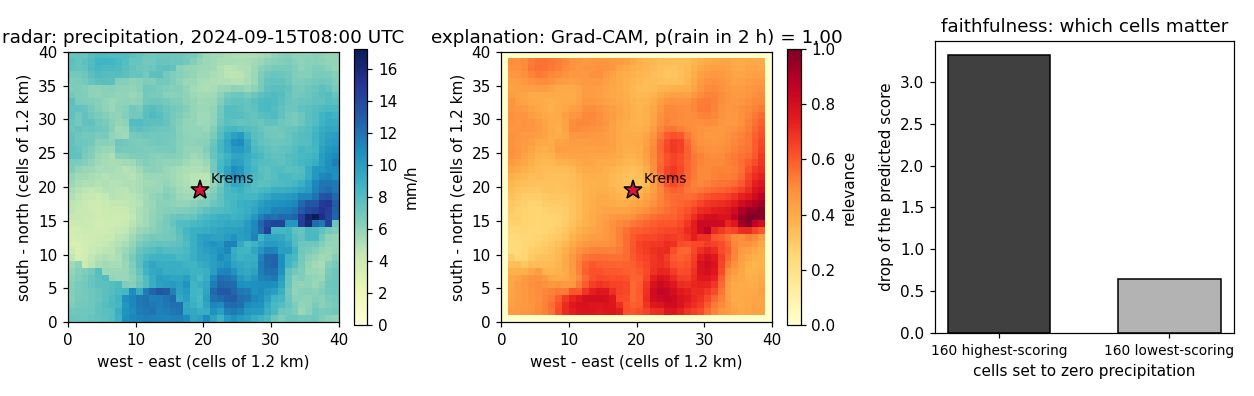
An explanation accompanies a prediction, and this demo produces both from real data.
 feature
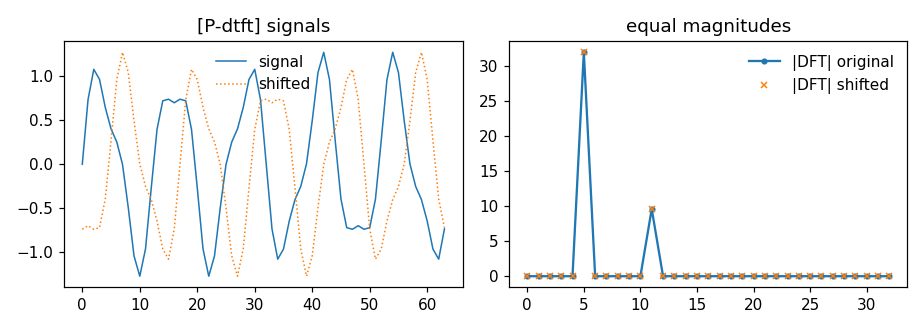
One block per paragraph of the entry (marked [P...]): each block verifies numerically what the corresponding statement asserts.
 feature importance
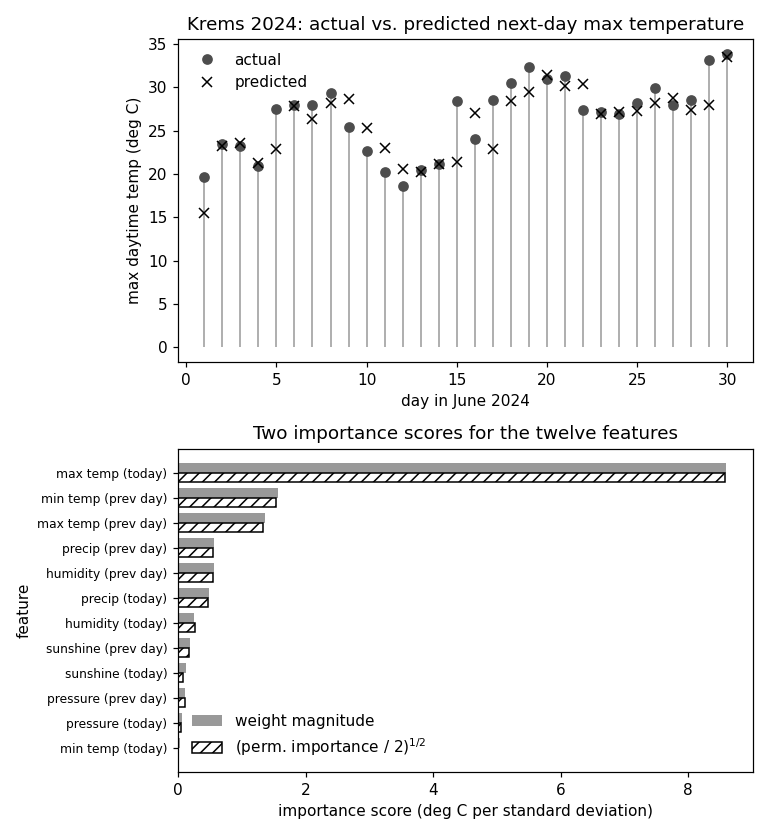
Numerical companion to the glossary entry 'featureimportance'.
 feature learning
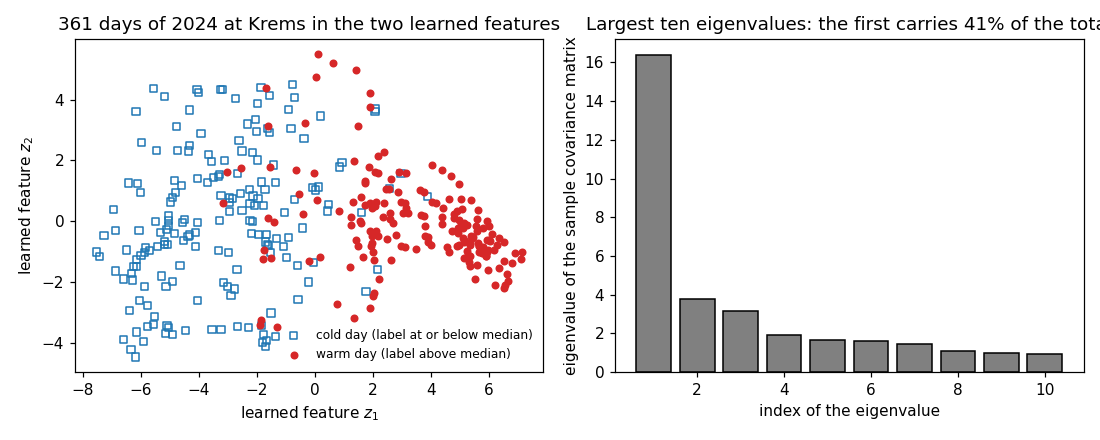
Numerical companion to the glossary entry 'featlearn' (feature learning).
 feature matrix
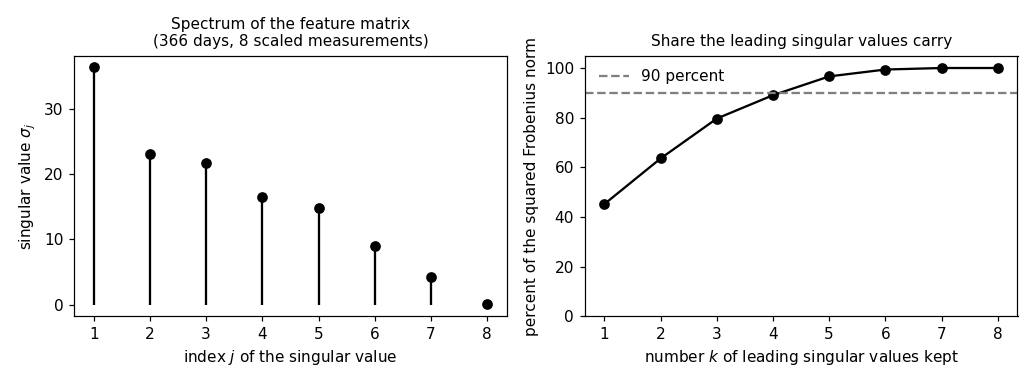
Numerical companion to the glossary entry 'featuremtx'.
 feature vector
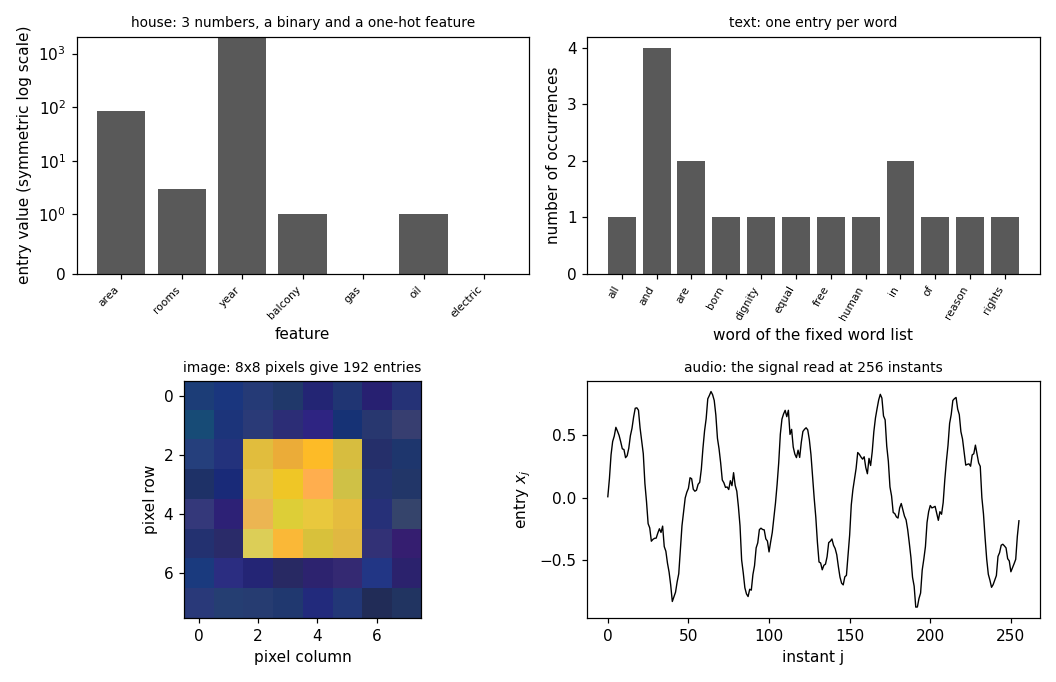
Every block builds a feature vector as a one-dimensional numpy array, for a different kind of data point, and checks that the array is what the entry says a feature vector is: a point of a Euclidean space whose dimension is the number of features.
 fine-tuning
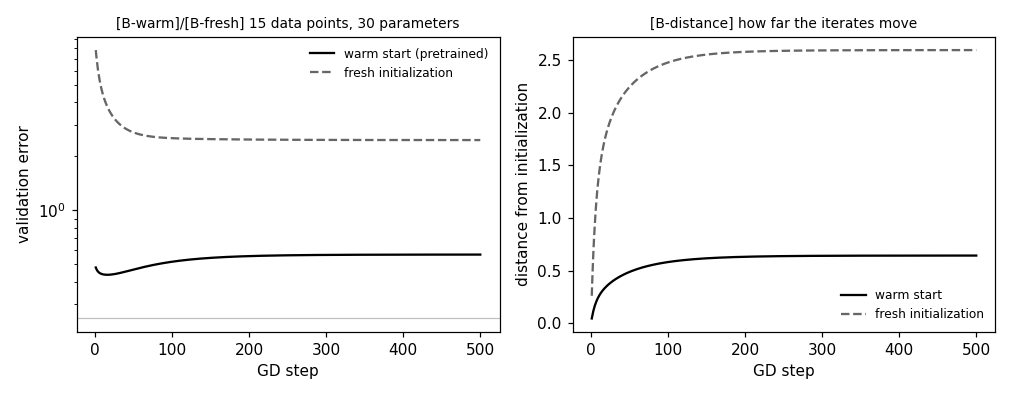
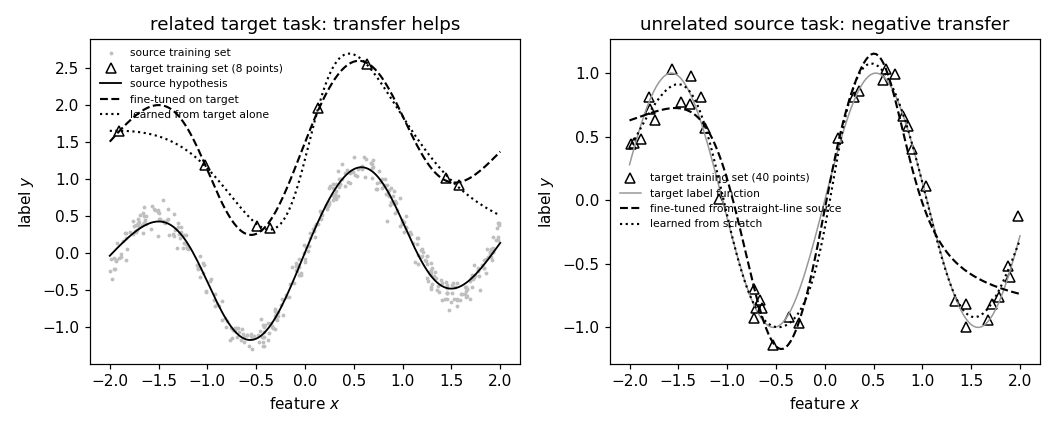
The entry's claims, measured: a linear hypothesis is pretrained on a large dataset from a related task, then adapted to a small task-specific training set by a few GD steps.
 Gaussian mixture model (GMM)
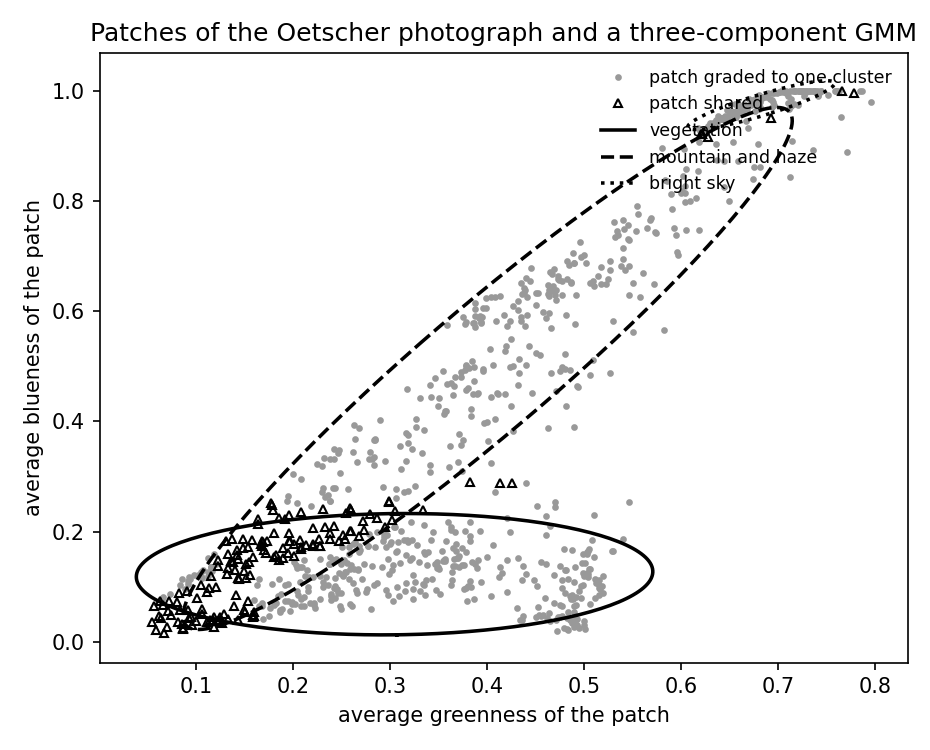
Numerical companion to the glossary entry 'gmm' (Gaussian mixture model).
 Gaussian random variable (Gaussian RV)
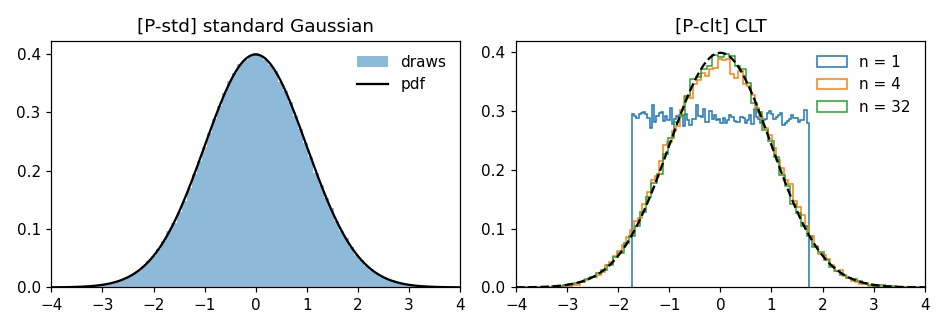
One block per paragraph of the entry (marked [P...]), in entry order: each block verifies numerically what the corresponding paragraph asserts.
 generalization
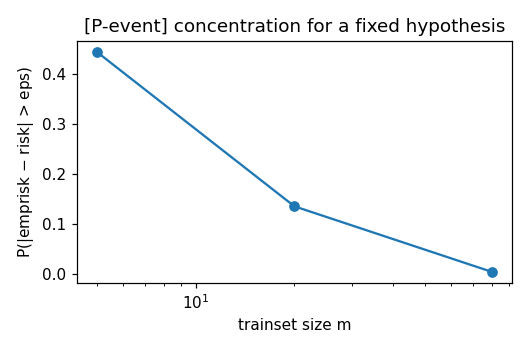
One block per paragraph of the entry (marked [P...]): each block verifies numerically what the corresponding statement asserts.
 gradient
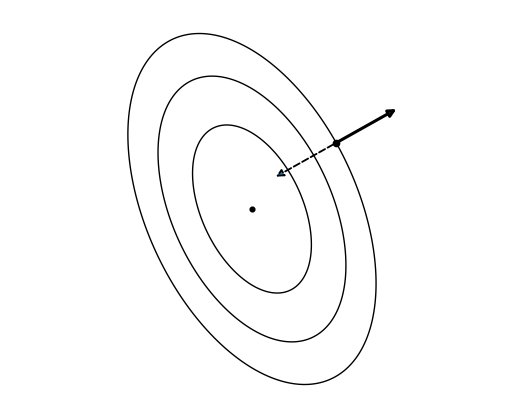
Verifies, for the quadratic f(w) = (1/2) w^T Q w with Q = [[2, 0.6], [0.6, 1]], the defining and geometric properties of the gradient stated in the entry, and generates the level-set data for the entry's figure.
 gradient descent (GD)
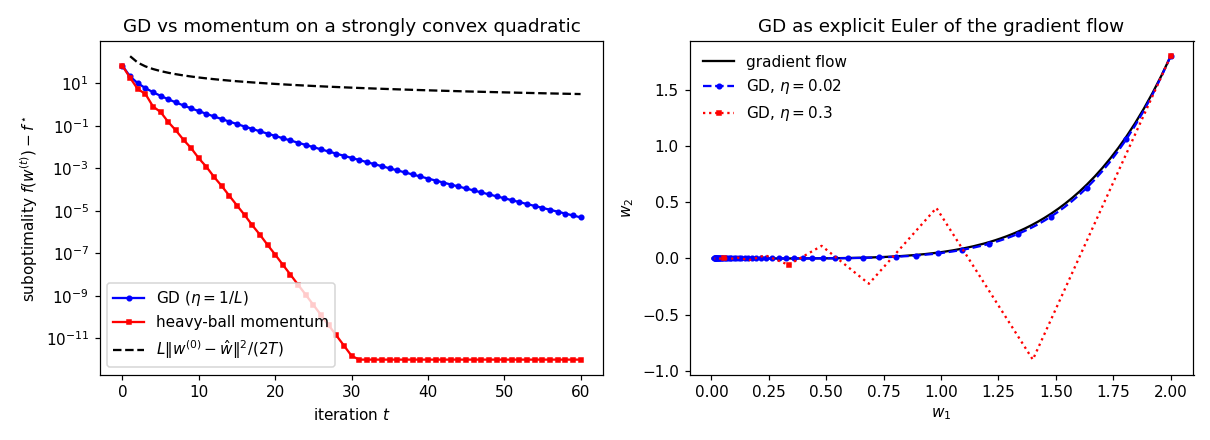
One block per claim of the entry (marked [P...]): each block verifies numerically what the corresponding statement asserts, so the entry's claims are backed by a small reproducible experiment.
 Hilbert space
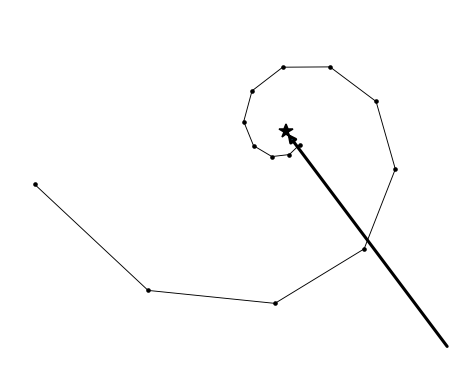
Backs the entry's completeness discussion and its two examples: it generates the Cauchy sequence shown in the entry's figure (converging to a limit that again belongs to the space), and it verifies that the expectation E{x x'} is an inner product on the finite-variance random variables of a common probability space, once random variables that are equal with probability one are identified.
 hyperparameter
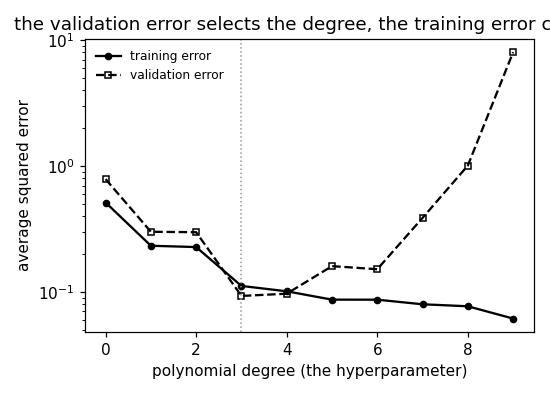
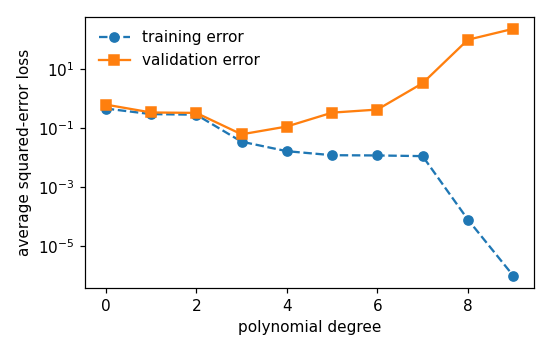
Shows why a hyperparameter is chosen by the validation error and not by the training error: for a polynomial model, the training error falls with every increase of the degree, while the validation error falls and then rises again, so only the validation error selects a degree.
 hypothesis
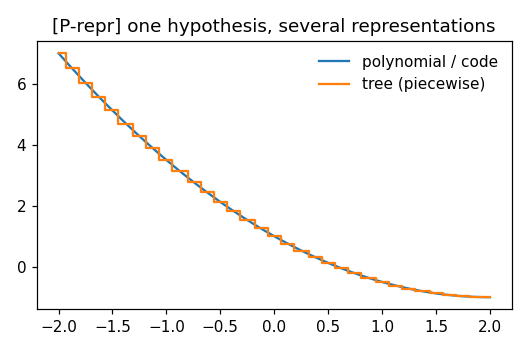
One block per paragraph of the entry (marked [P...]): each block verifies numerically what the corresponding statement asserts.
 hypothesis space
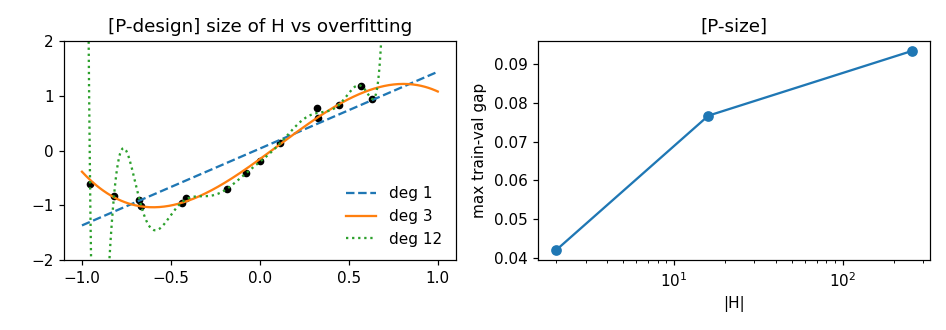
One block per paragraph of the entry (marked [P...]): each block verifies numerically what the corresponding statement asserts.
 independent and identically distributed assumption (i.i.d. assumption)
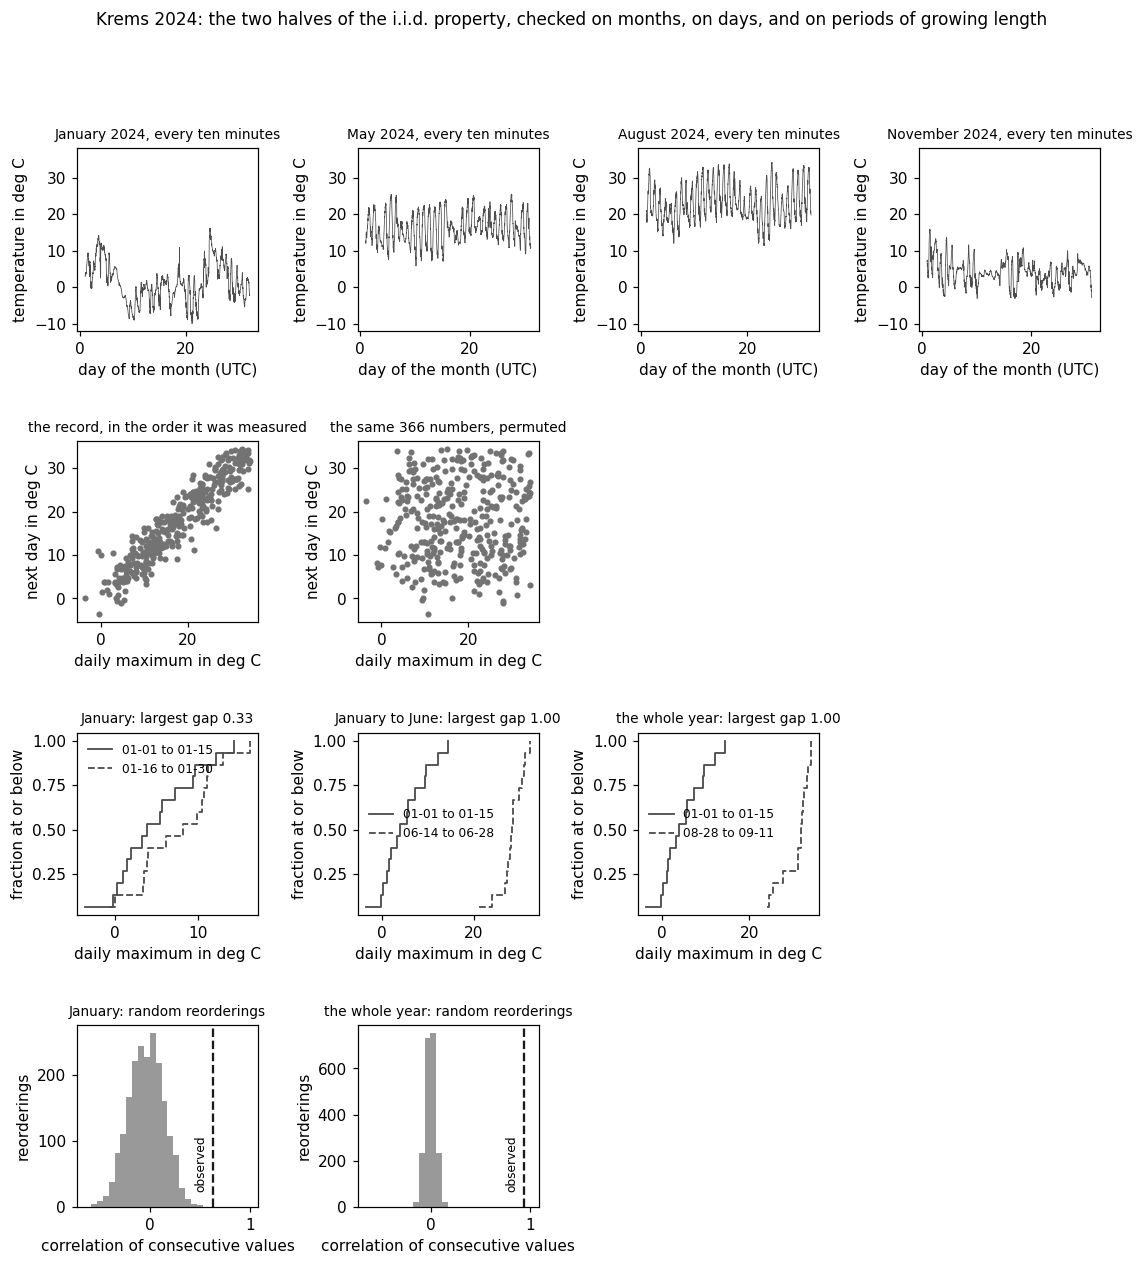
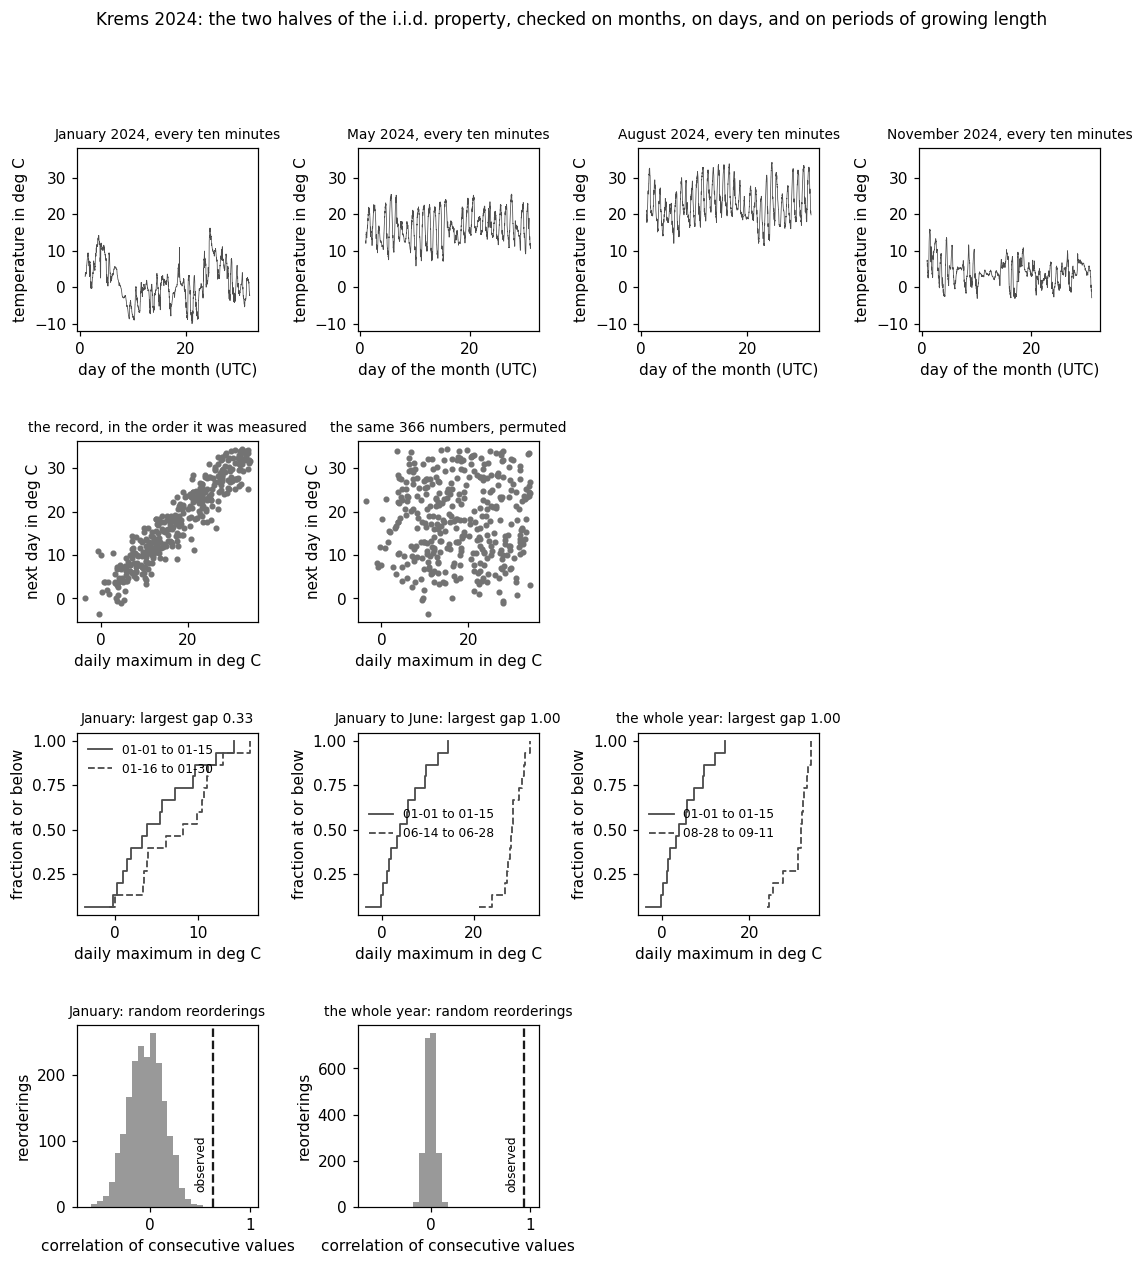
iidasspt.py — numerical companion to the glossary entry 'independent and identically distributed assumption (i.i.d.
 independent and identically distributed (i.i.d.)
Numerical companion to the glossary entry 'iid'.
 inner product
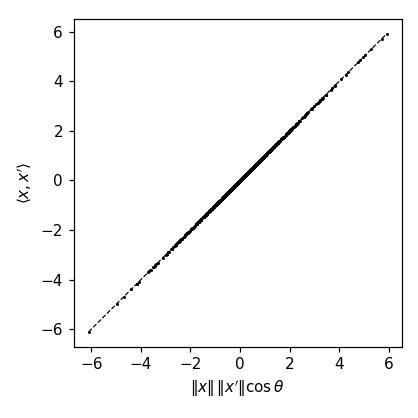
Verifies the entry's axioms, geometry, and ML tie-ins for the standard Euclidean inner product <x, x'> = x^T x' on R^d, and for the implicit inner products encoded by a Gaussian kernel.
 interpretability
One block per paragraph of the entry (marked [P...]), in order: each block verifies numerically what the corresponding statement asserts.
 interpretable machine learning (interpretable ML)
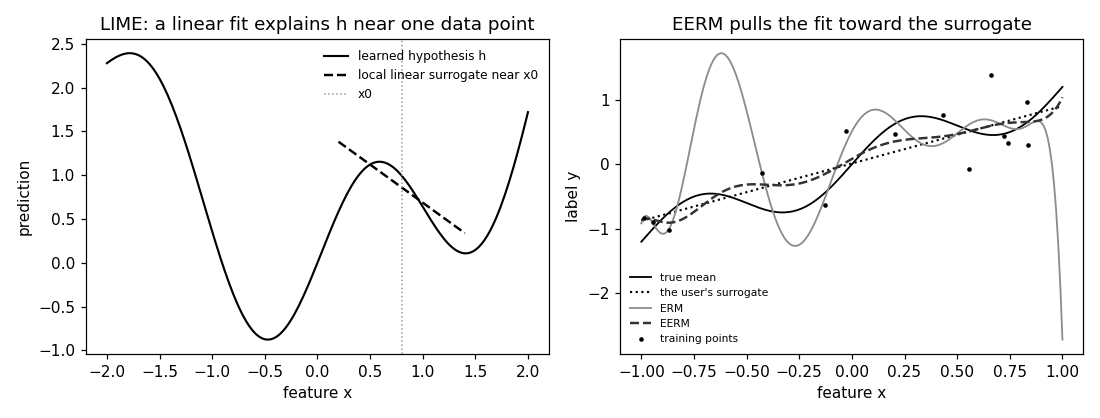
Backs the entry's two empirical claims on a synthetic trainset: restricting the hypothesis space to interpretable (sparse) hypotheses acts as regularization, and the resulting interpretable hypothesis achieves accuracy comparable to an opaque (dense) one.
 kernel method
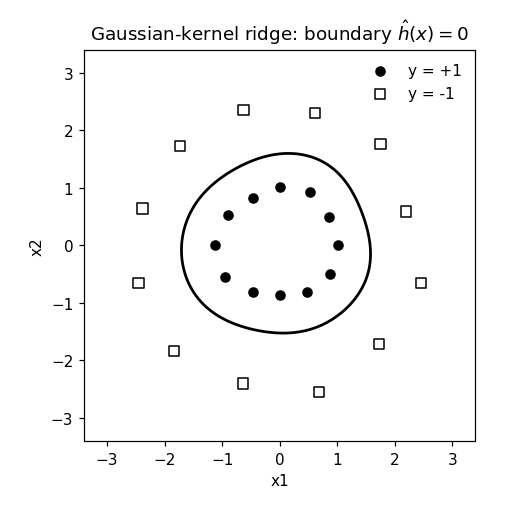
A two-ring binary trainset in R^2 that no linear classifier separates, on which a Gaussian-kernel method learns a perfect nonlinear decision boundary.
 kernel ridge regression
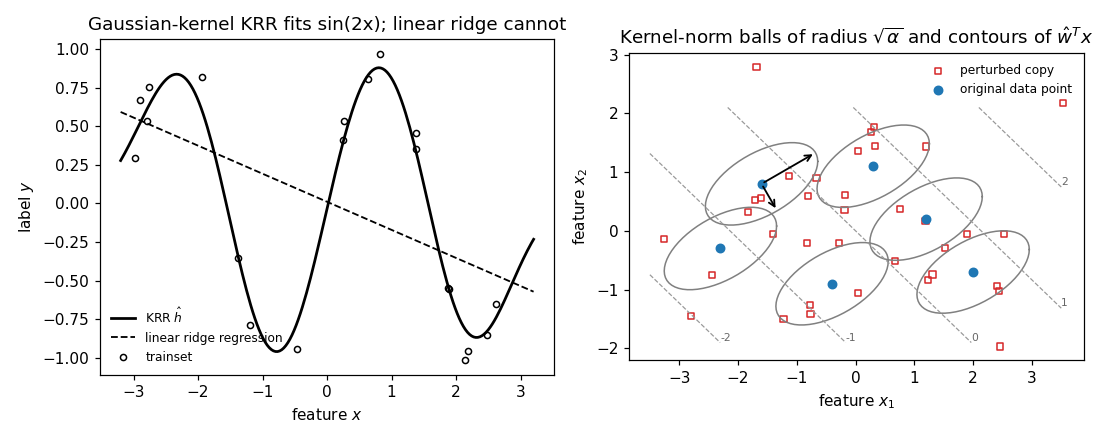
Kernel ridge regression (KRR) is RERM over the RKHS H_k with the squared error loss,
 k-fold cross-validation (k-fold CV)
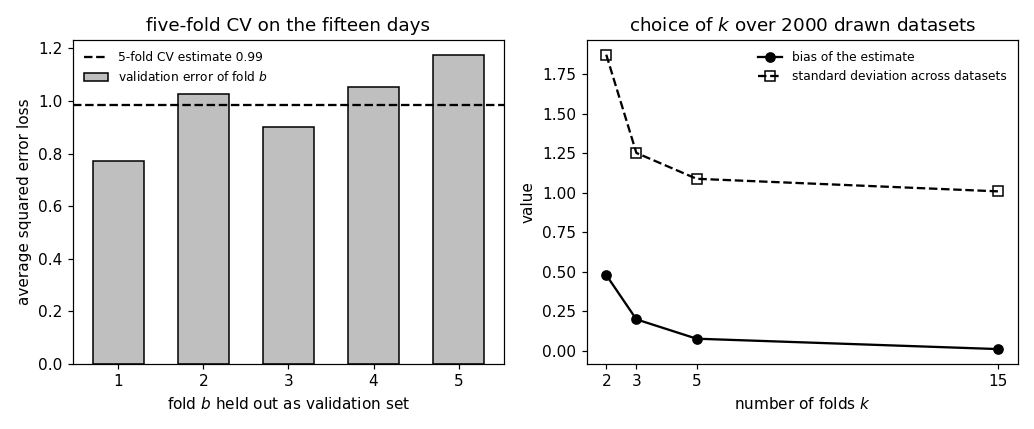
Carries out the entry's four-day weather example and backs its claims: a single split can hand back a small validation error for a hypothesis that is useless away from the data, and averaging over all k splits exposes that; and the choice of k trades bias against variance of the estimate.
 k-means
Numerical companion to the glossary entry 'kmeans' ($k$-means).
 label
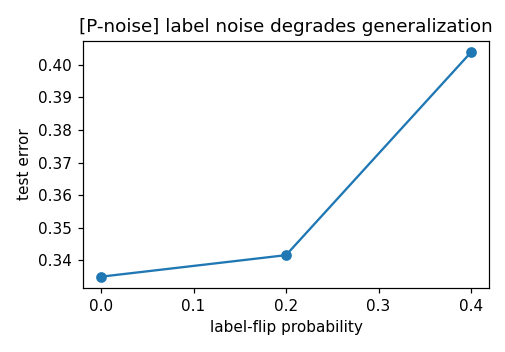
One block per paragraph of the entry (marked [P...]): each block verifies numerically what the corresponding statement asserts.
 large language model (LLM)
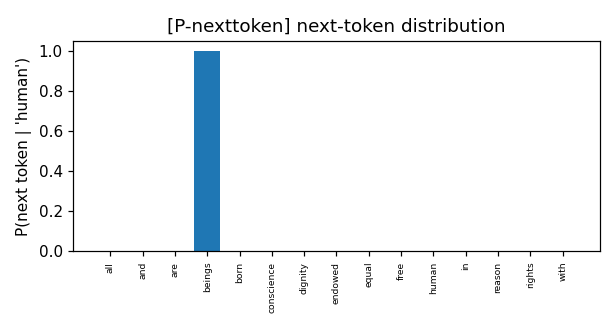
Blocks verify numerically what the entry's statements assert.
 learning rate
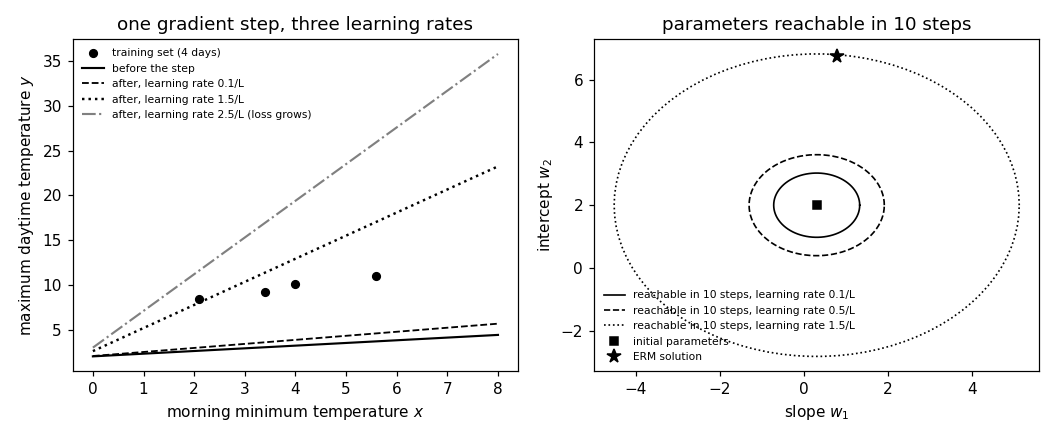
Shows what the learning rate of a gradient step does to the HYPOTHESIS MAP and to the set of model parameters that a fixed number of gradient steps can reach.
 linear classifier
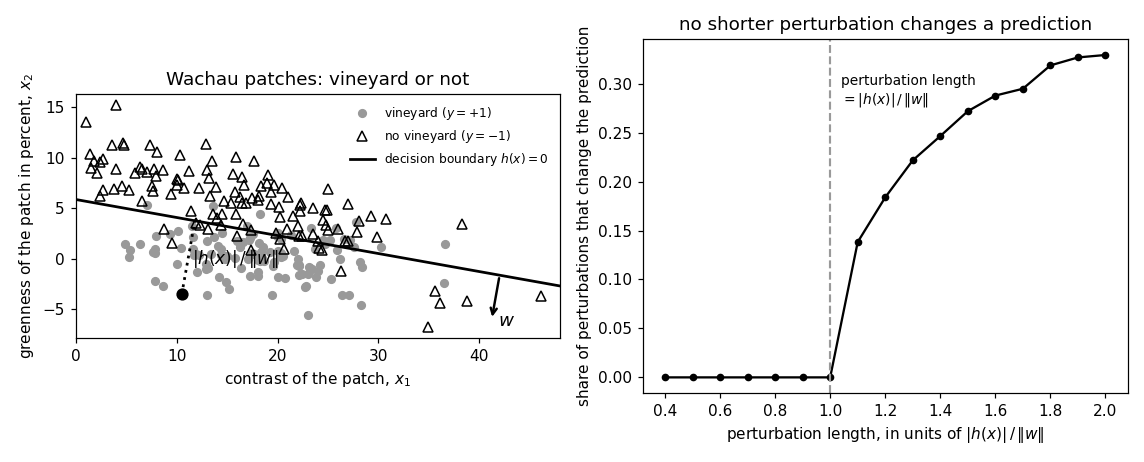
A binary classification trainset for the vineyard task: each data point is a square patch of an aerial photograph, described by two numeric features — the contrast of the patch (the standard deviation of its pixel brightness) and its greenness (the relative difference between the average green and the average red channel value, in percent) — and labelled +1 if the patch shows a vineyard and -1 otherwise.
 linear regression
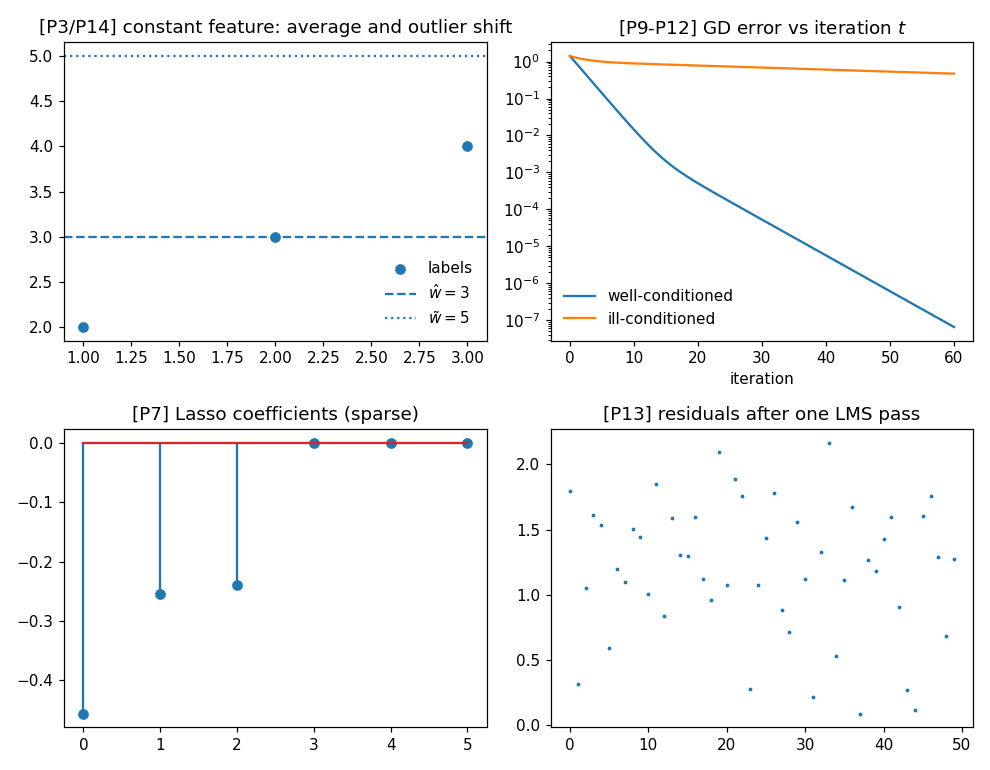
One block per paragraph of the entry (marked [P1], [P2], ...): each block verifies numerically what the corresponding paragraph claims, so the entry's statements are backed by a small reproducible experiment.
 logistic loss
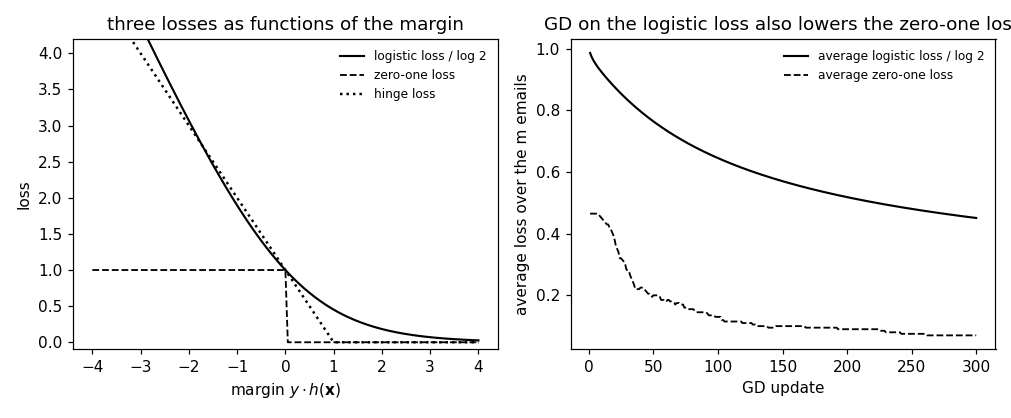
Backs the entry's claims about the logistic loss numerically: divided by log 2 it is an upper bound on the zero-one loss with equality at margin 0; it is convex and differentiable everywhere while the hinge loss has a kink at margin 1; the average zero-one loss is flat almost everywhere in the model parameters, so GD gets no direction from it, whereas GD on the average logistic loss decreases it at every step and thereby also drives the zero-one loss down.
 logistic regression
Two binary classification trainsets.
 loss
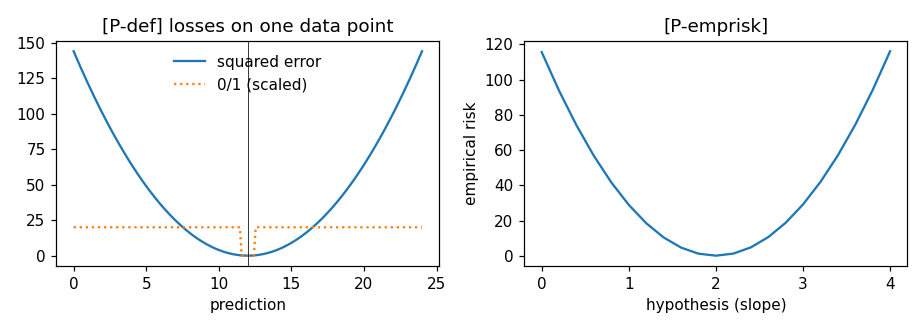
One block per paragraph of the entry (marked [P...]): each block verifies numerically what the corresponding statement asserts.
 machine learning pipeline (ML pipeline)
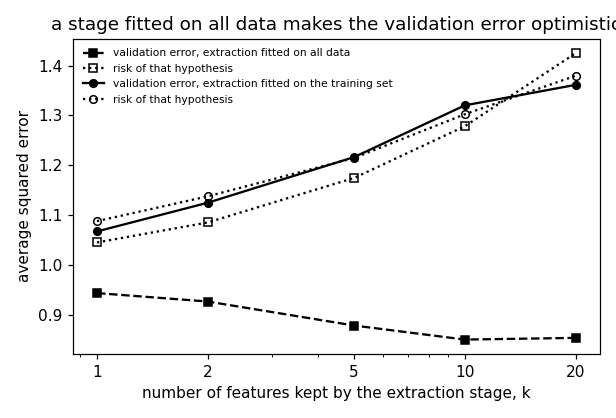
Shows why a stage of an ML pipeline that has its own parameters must be fitted on the training set only.
 matrix
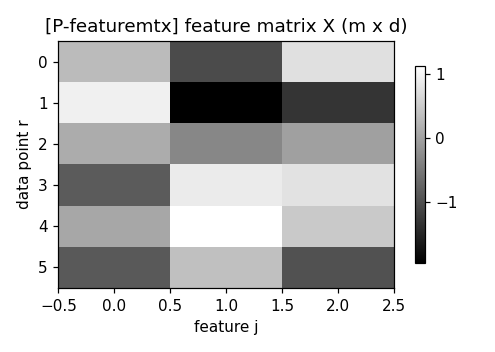
One block per paragraph of the entry (marked [P...]): each block verifies numerically what the corresponding statement asserts.
 mean
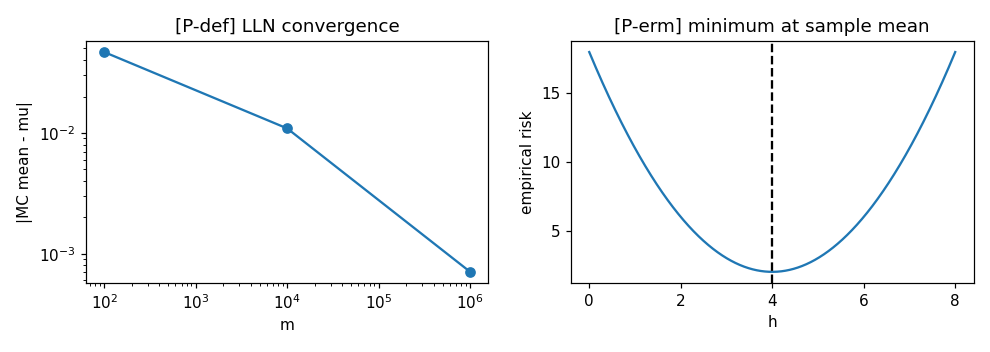
One block per paragraph of the entry (marked [P...]): each block verifies numerically what the corresponding statement asserts.
 membership inference attack
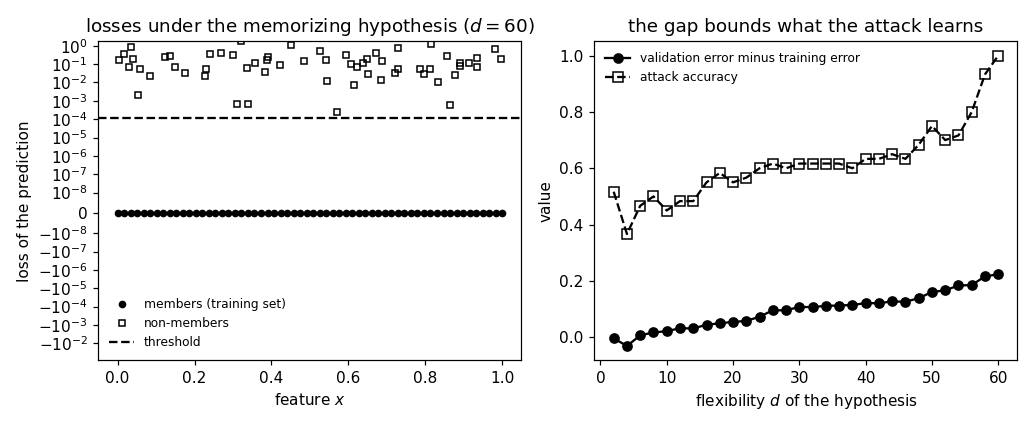
Shows the signal the attack uses and what bounds it: a hypothesis that memorizes its training set incurs no loss on its members and a visible loss on data points it never saw, so a loss threshold decides membership; and the attack's accuracy rises and falls with the gap between training error and validation error, so a hypothesis that generalizes leaks little.
 model
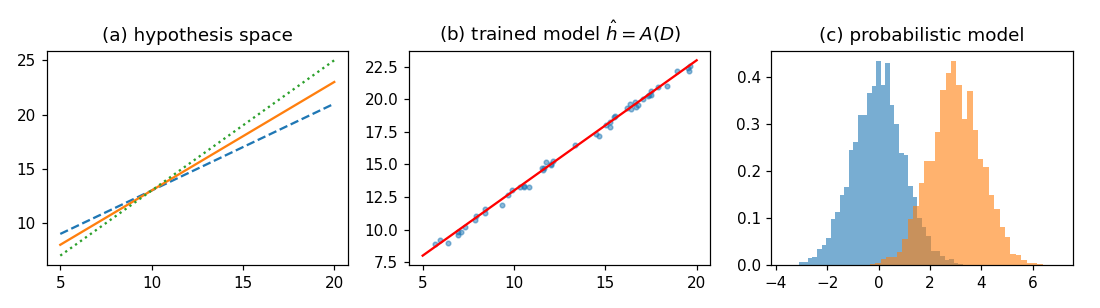
One block per paragraph of the entry (marked [P...]): each block verifies numerically what the corresponding statement asserts.
 model selection
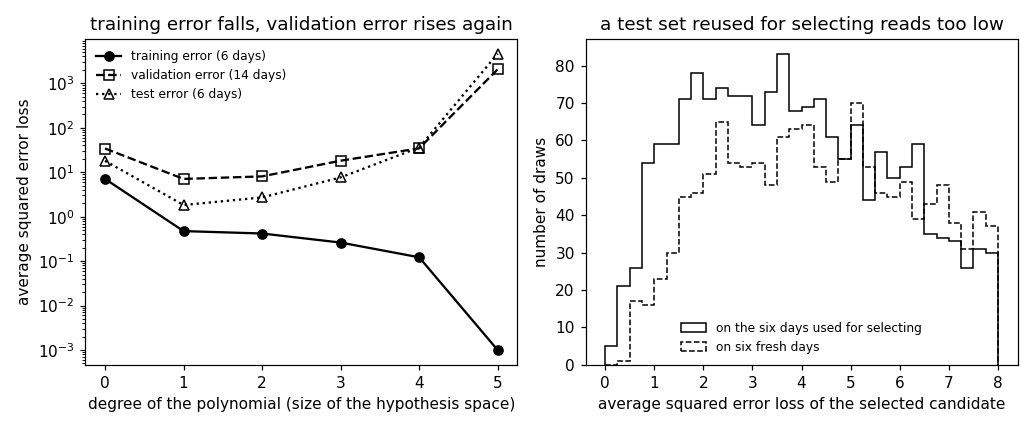
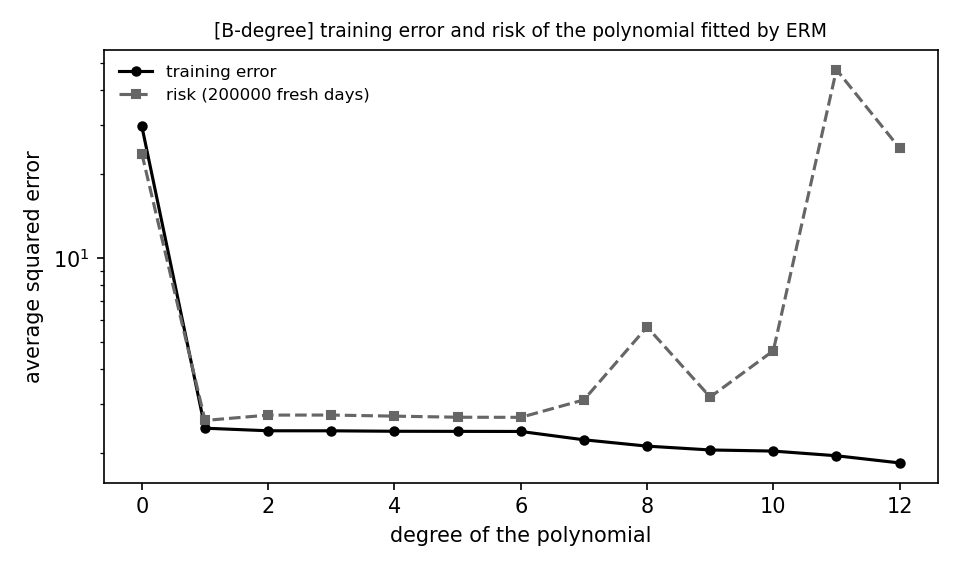
Backs the entry's claims with numbers: the training error falls as the hypothesis space grows while the risk eventually rises again, so the training error cannot select; the validation error can; and a test set that is used to select underestimates the risk of the candidate finally chosen.
 norm
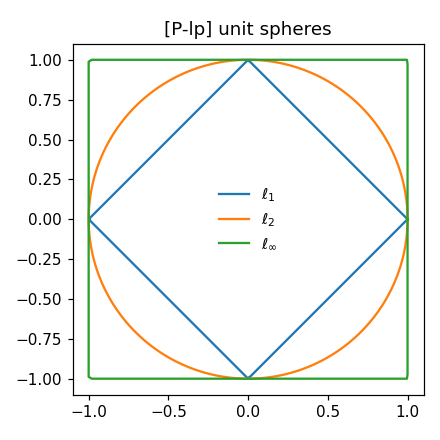
One block per paragraph of the entry (marked [P...]): each block verifies numerically what the corresponding statement asserts.
 online learning
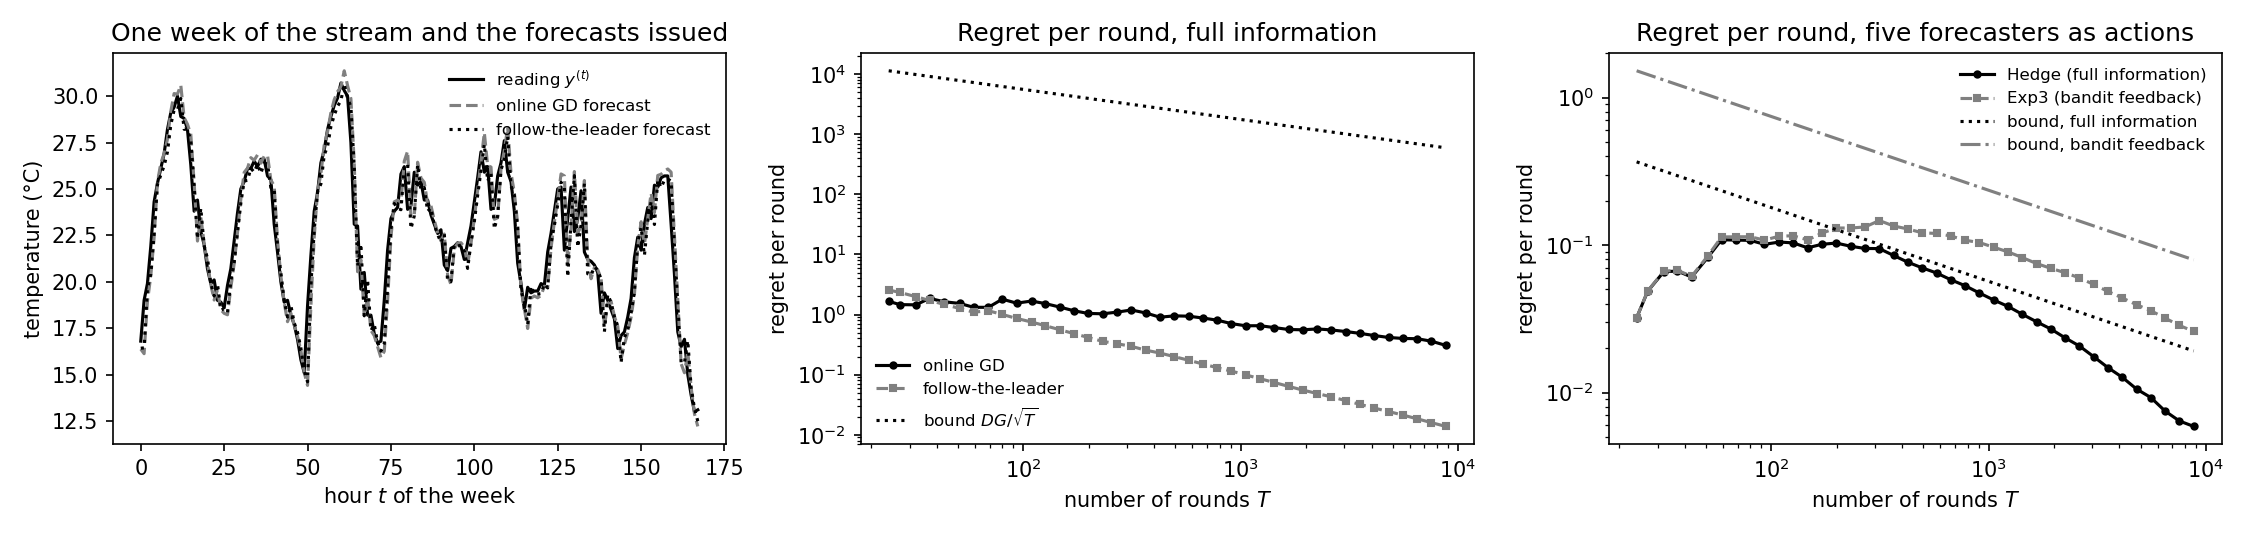
Numerical companion to the glossary entry 'onlinelearning'.
 overfitting
 policy (reinforcement learning)
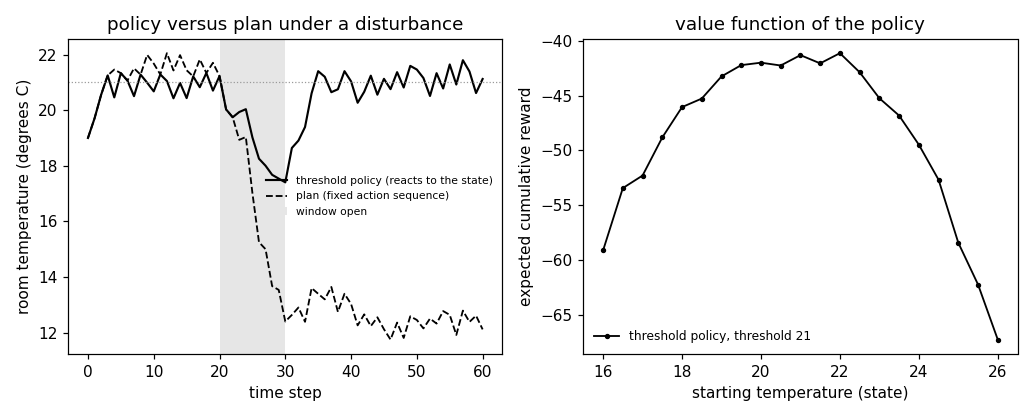
Shows what a policy is and what it is for: a function from the state to the action that reacts to the state it meets, as against a plan (a fixed sequence of actions); a stochastic policy that draws the action from a probability distribution given the state; and the value function of a policy, the expected cumulative reward obtained by following it from a state, which is what the policy is learned to maximize.
 pretraining
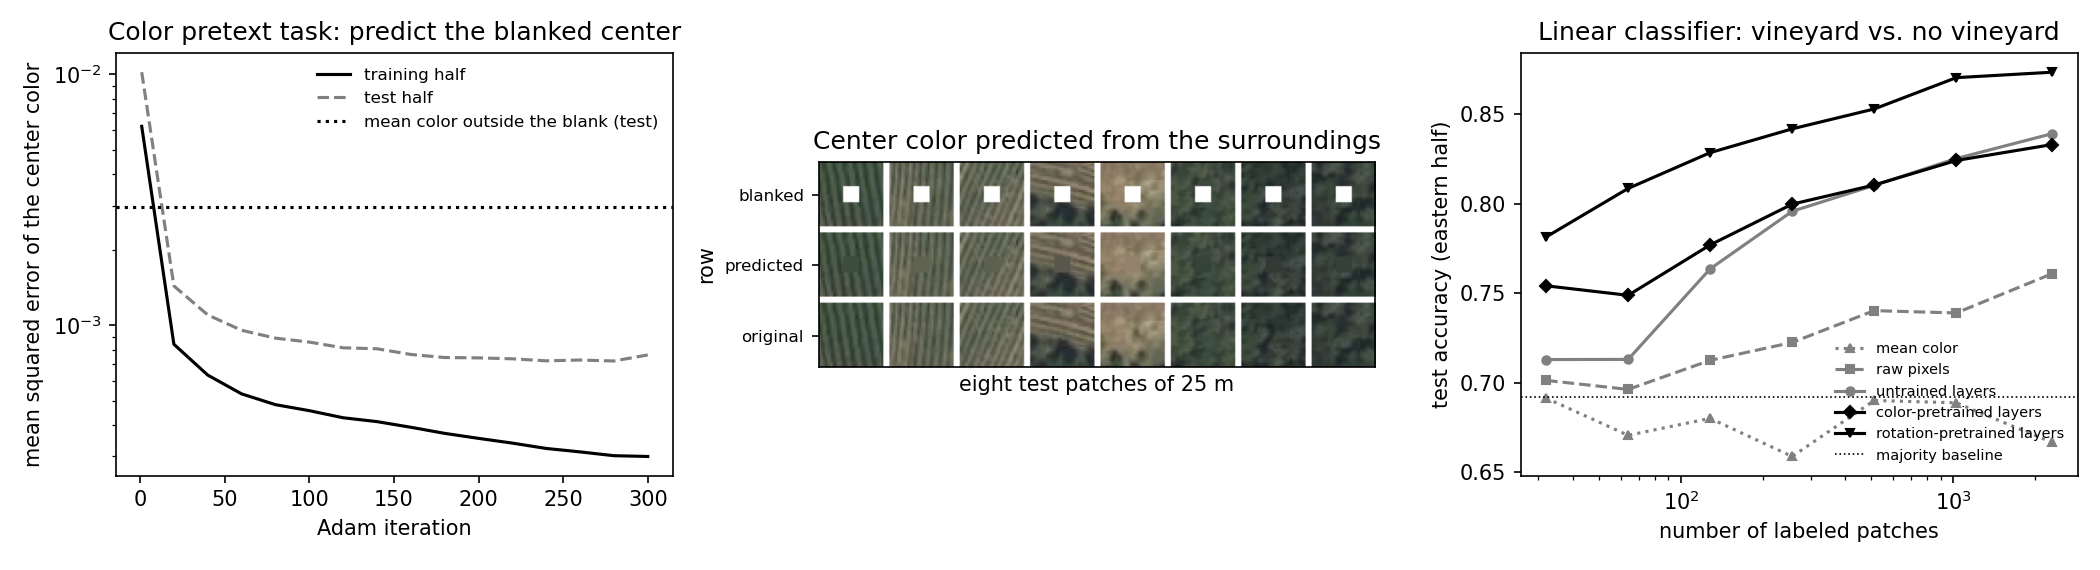
Numerical companion to the glossary entry 'pretraining'.
 principal component analysis (PCA)
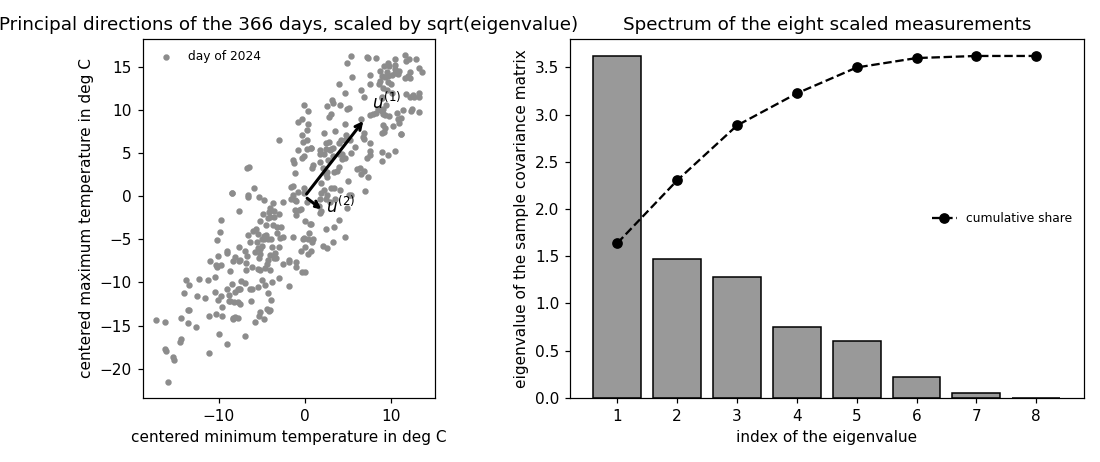
Numerical companion to the glossary entry 'pca'.
 probability distribution
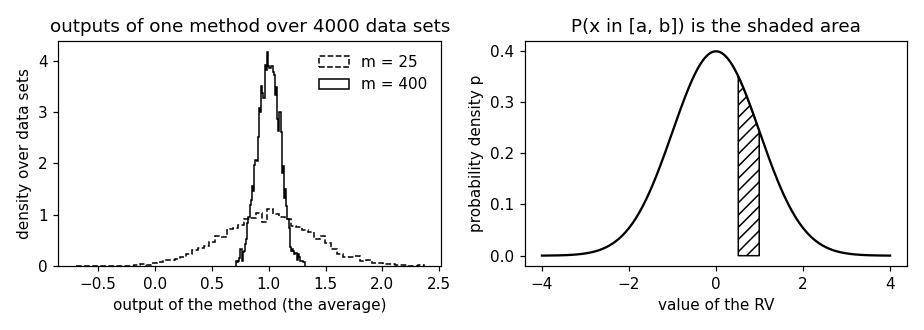
One block per paragraph of the entry (marked [P...]): each block verifies numerically what the corresponding statement asserts.
 projection
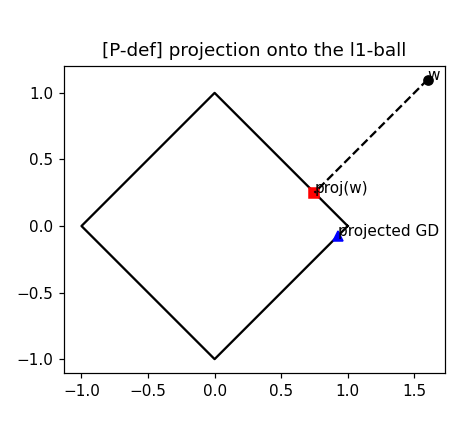
One block per paragraph of the entry (marked [P...]): each block verifies numerically what the corresponding statement asserts.
 random experiment
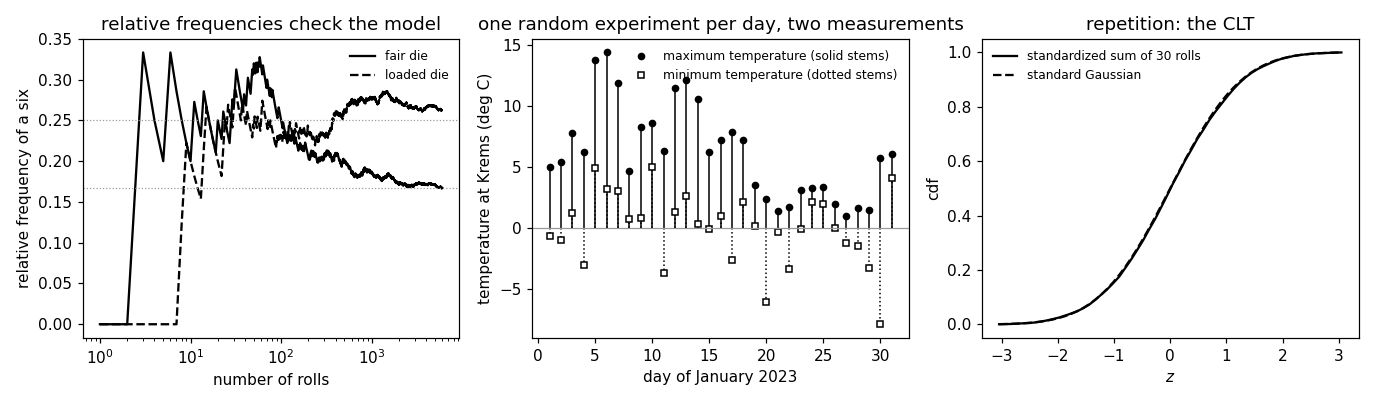
Backs the entry's claims with three random experiments: rolling a die, whose probability measure is a model that the relative frequencies of many rolls check; the weather of a day at Krems an der Donau, whose outcome is read through a random variable (RV) whose probability distribution the probability measure on the sample space induces; and the repetition of an experiment, whose outcomes are sequences, whose measurements are i.i.d.
 random forest
Numerical companion to the glossary entry 'randomforest' (random forest).
 random variable (RV)
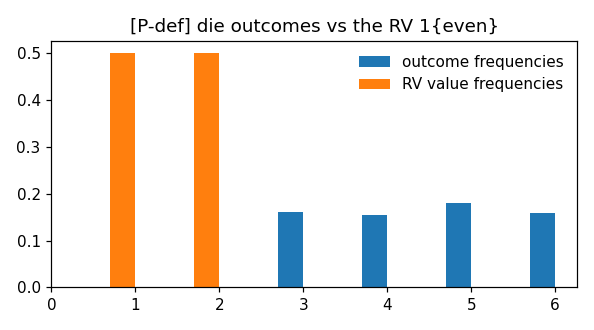
One block per paragraph of the entry (marked [P...]), in order: each block verifies numerically what the corresponding paragraph asserts.
 regularization
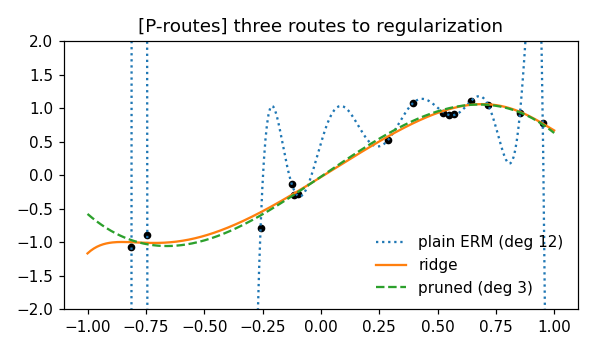
One block per paragraph of the entry (marked [P...]): each block verifies numerically what the corresponding statement asserts.
 reinforcement learning (RL)
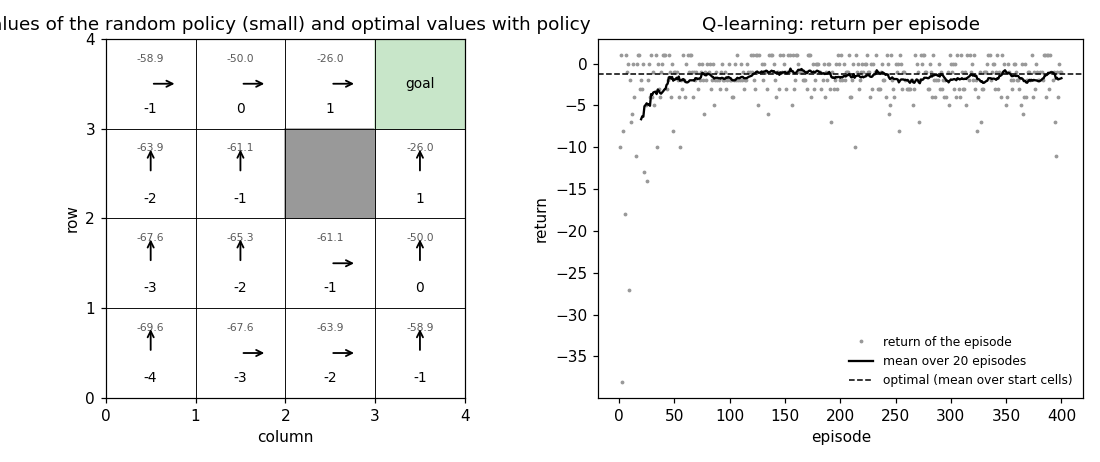
Numerical companion to the glossary entry 'reinforcementlearning' (reinforcement learning (RL)).
 reward
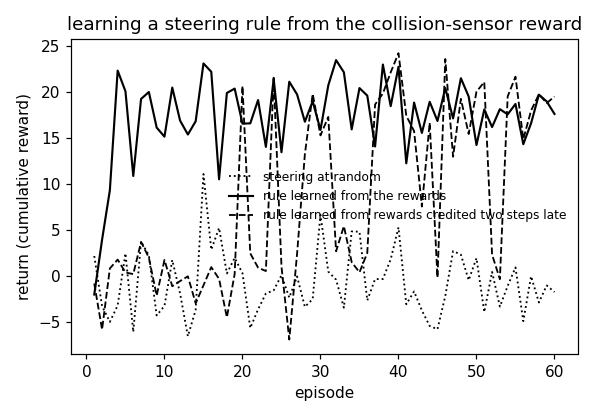
Shows what separates a reward from a label: the reward scores only the action that was taken, it may arrive delayed and corrupted by noise, and a reinforcement learning method still learns from it by treating the negative reward as the loss of that action and choosing actions that maximize the cumulative reward.
 robust principal component analysis (robust PCA)
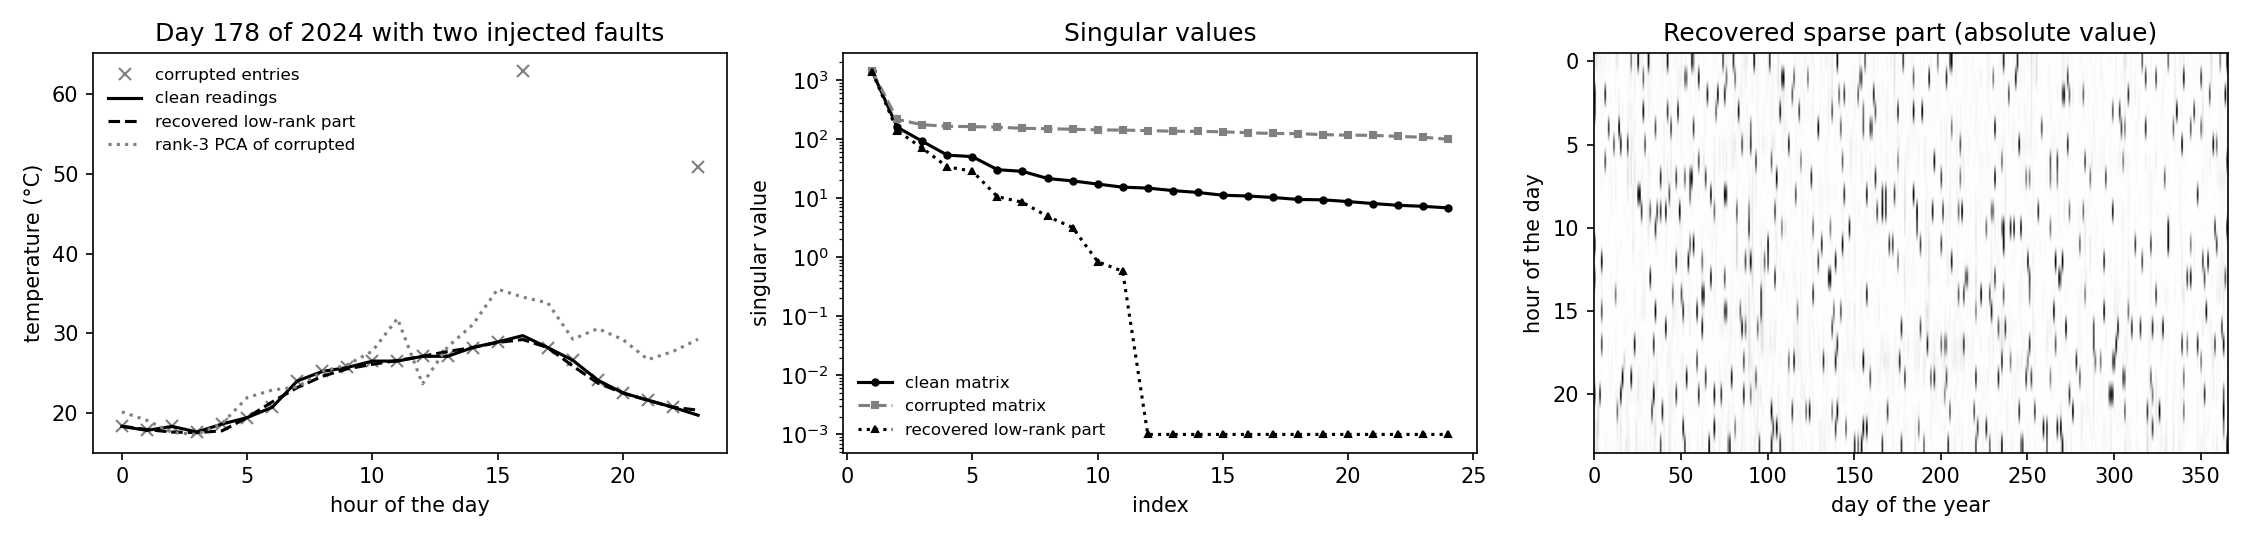
Numerical companion to the glossary entry 'rpca'.
 sample size
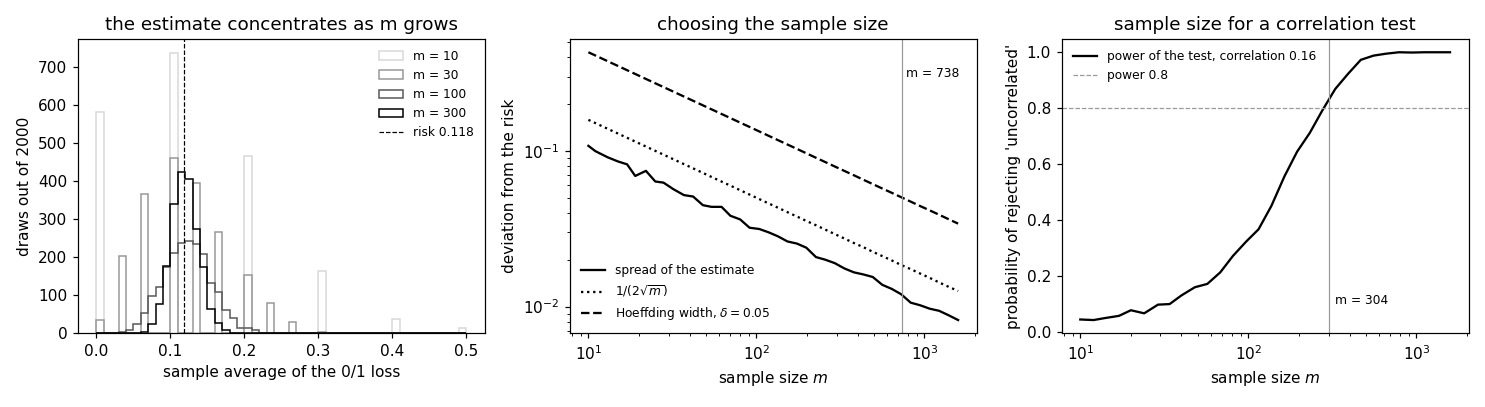
Backs the entry's chain of claims on the frost-warning hypothesis of Krems an der Donau: a hypothesis is evaluated by its expected loss (the risk) under the i.i.d.
 self-supervised learning
One block per paragraph of the entry (marked [P...]): each block verifies numerically what the corresponding statement asserts.
 sigmoid function
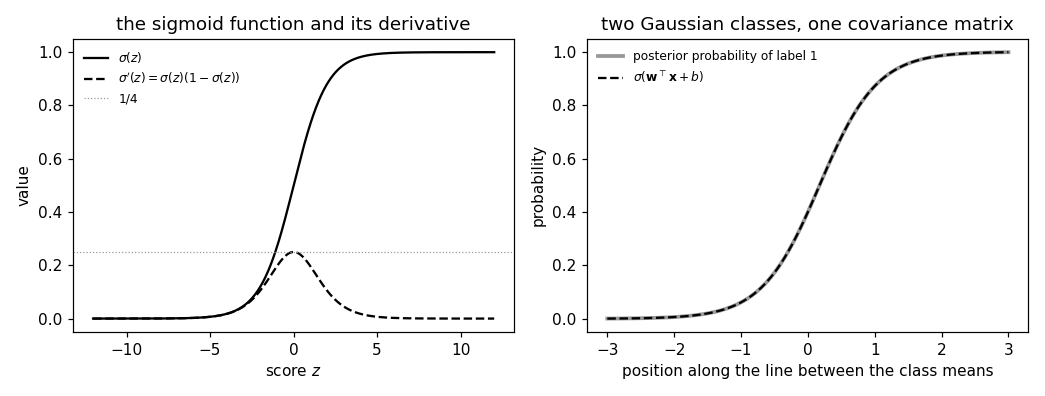
Checks the entry's claims about the sigmoid function sigma(z) = 1 / (1 + exp(-z)): its range, limits and symmetry; the closed form of its derivative, its maximum 1/4 and its vanishing for large |z|; and the log-odds reading, where sigma of a linear function of the feature vector is exactly the posterior probability of the label when the feature vectors of the two classes are Gaussian with one shared covariance matrix.
 singular value decomposition (SVD)
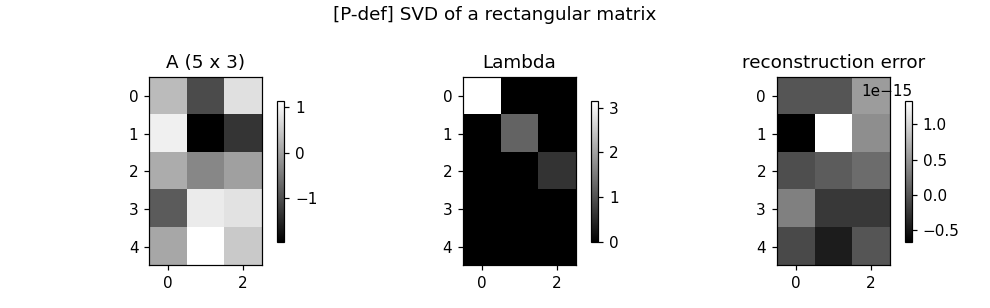
One block per paragraph of the entry (marked [P...]): each block verifies numerically what the corresponding statement asserts.
 Sobolev space
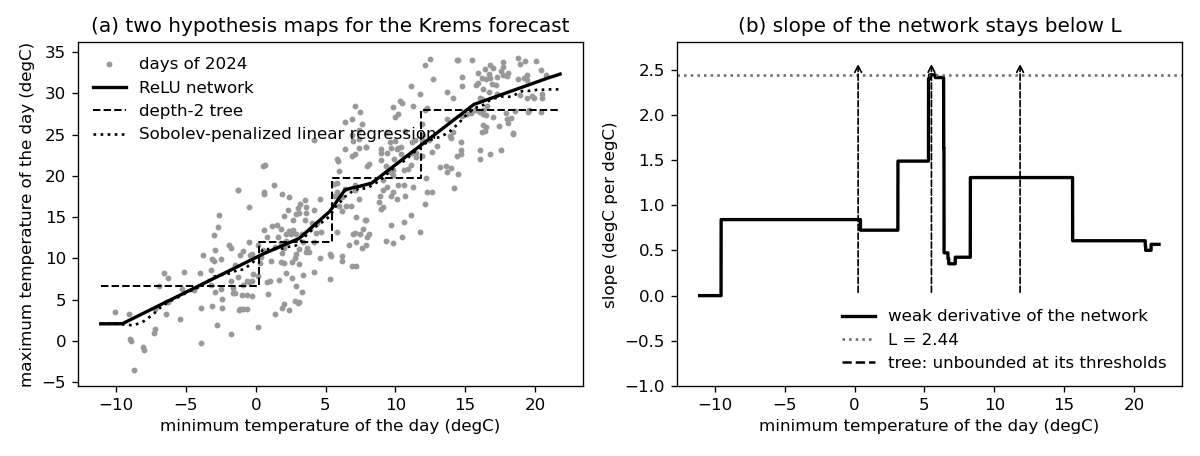
Running example: forecast the maximum temperature of a day at the GeoSphere station Krems (station id 3805) from its minimum temperature.
 stochastic gradient descent (SGD)
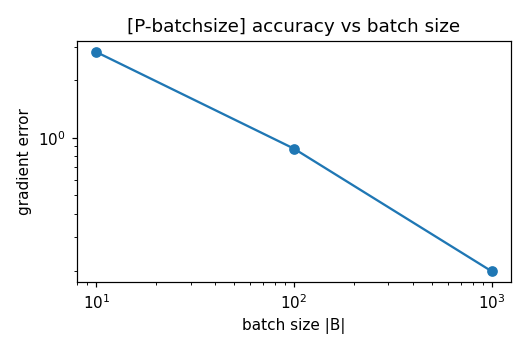
One block per claim/figure of the entry (marked [B-...], linked from the entry's paragraphs by content): each block verifies numerically what the corresponding statement asserts or generates the data behind a figure.
 supervised learning
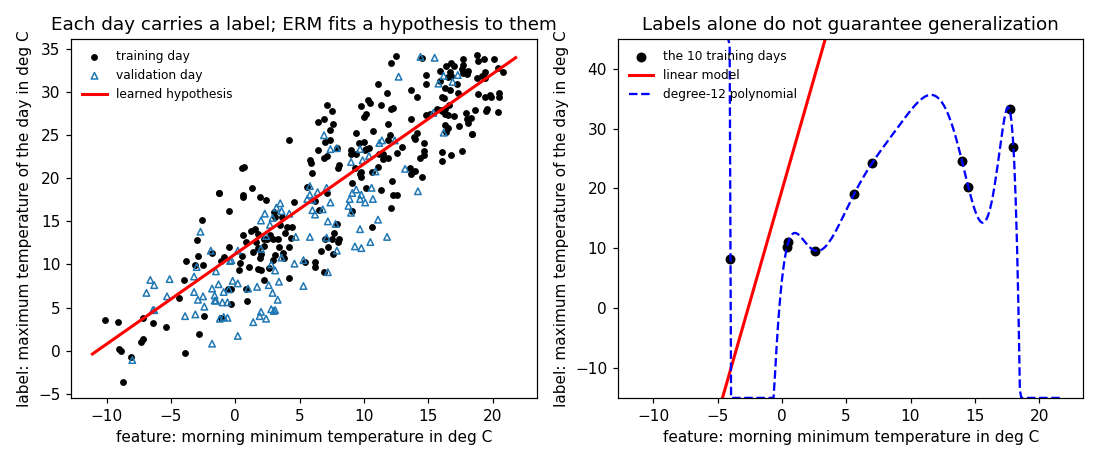
Numerical companion to the glossary entry 'supervisedlearning'.
 support vector machine (SVM)
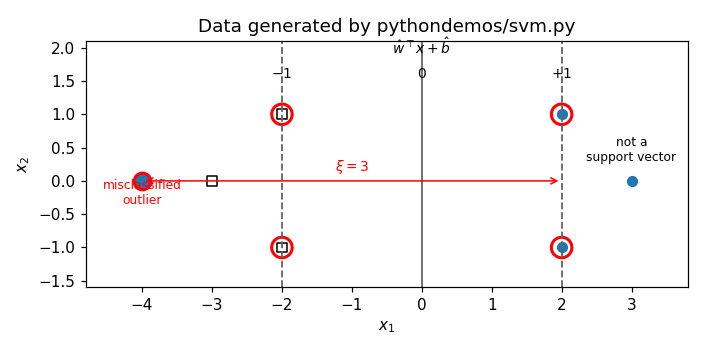
A small, hand-crafted non-separable toy trainset in R^2 whose soft-margin SVM solution leaves exactly one data point misclassified *beyond* the opposite margin, i.e.
 tabular data
The demo gathers actual weather measurements from the open data server of the Finnish Meteorological Institute (FMI): daily minimum temperature, precipitation, and maximum temperature at the Helsinki Kaisaniemi station (fmisid 100971) for the year 2024.
 test set
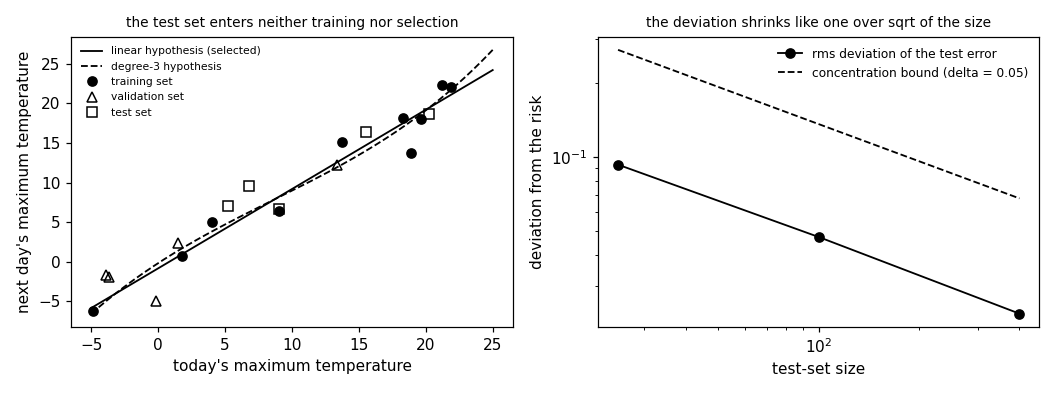
The Krems weather narrative of the entry: today's maximum temperature is the feature, the next day's maximum temperature the label, and the data generation is a known linear rule plus Gaussian noise, so the risk of any hypothesis is computable and every claim of the entry can be checked against it.
 training
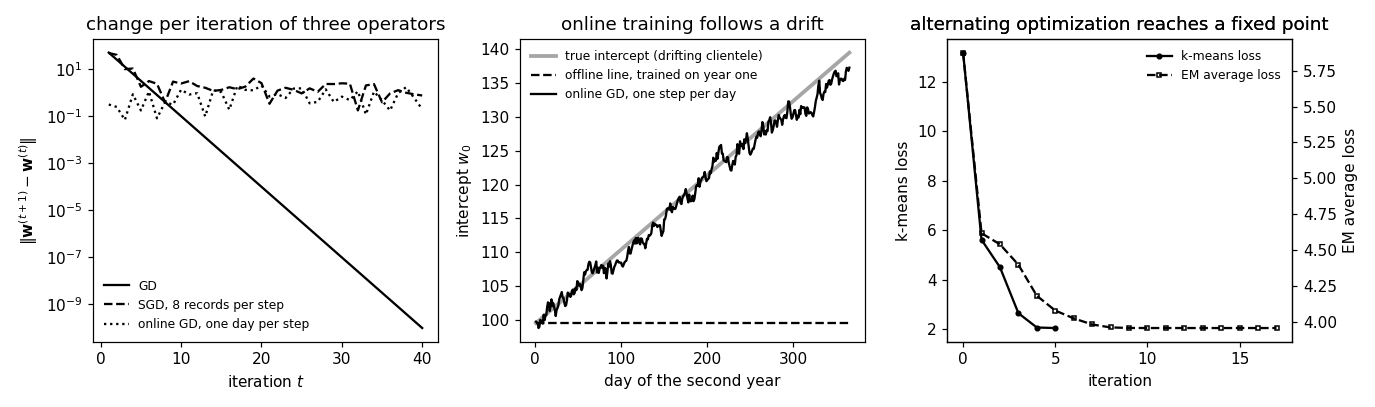
Backs the entry's view of training as an iteration w^(t+1) = T(w^(t)) whose operator T is settled by the ML setting: offline ERM by gradient descent (GD), SGD when the training set is large, online GD when data points arrive one at a time, and alternating optimization in unsupervised settings (k-means, and the EM algorithm for a GMM).
 training error
The entry's weather narrative, carried out on the record itself: the daily minimum and maximum air temperature at Krems an der Donau for all 366 days of 2024 (GeoSphere Austria, station 3805, dataset klima-v2-1d).
 training set
The entry's weather narrative, carried out: three days of synthetic weather recordings (morning minimum temperature as feature, maximum daytime temperature as label) form the training set, and two hypotheses are learned from it -- a straight line and a degree-two polynomial.
 transfer learning
Backs the entry's story on real weather records: every weather station is its own learning task (predict the maximum temperature of a day from its minimum temperature with a straight line), a task is characterized by the probability distribution of its data points, and transfer learning couples the tasks of similar stations.
 transformer
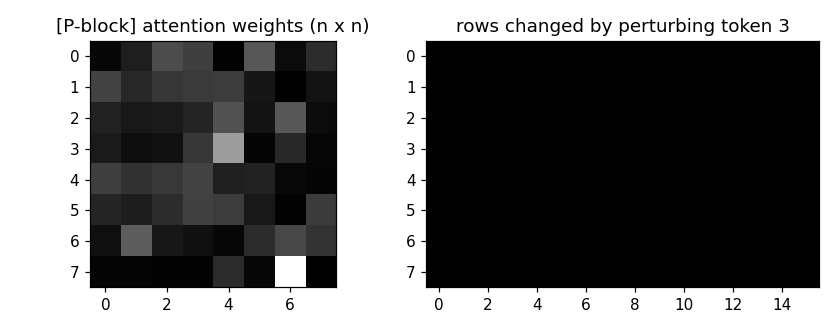
Downloads the INCA 1-hour precipitation analysis (GeoSphere Austria) for a fixed timestamp, resamples it onto a 96 x 96 pixel image of 1 km resolution centered on Krems an der Donau, and cuts the image into 16 x 16-pixel patches.
 transparency
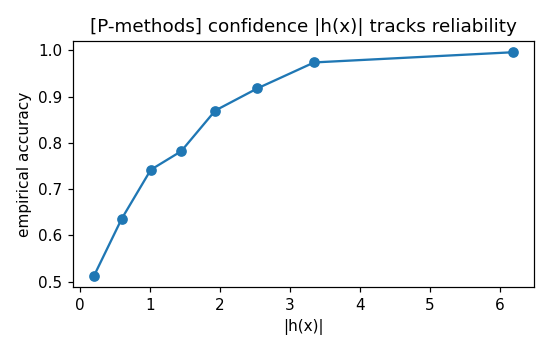
One block per technical paragraph of the entry (marked [P...]): the entry is a regulation term, so its legal paragraphs (EU AI Act Arts.
 trusted execution environment (TEE)
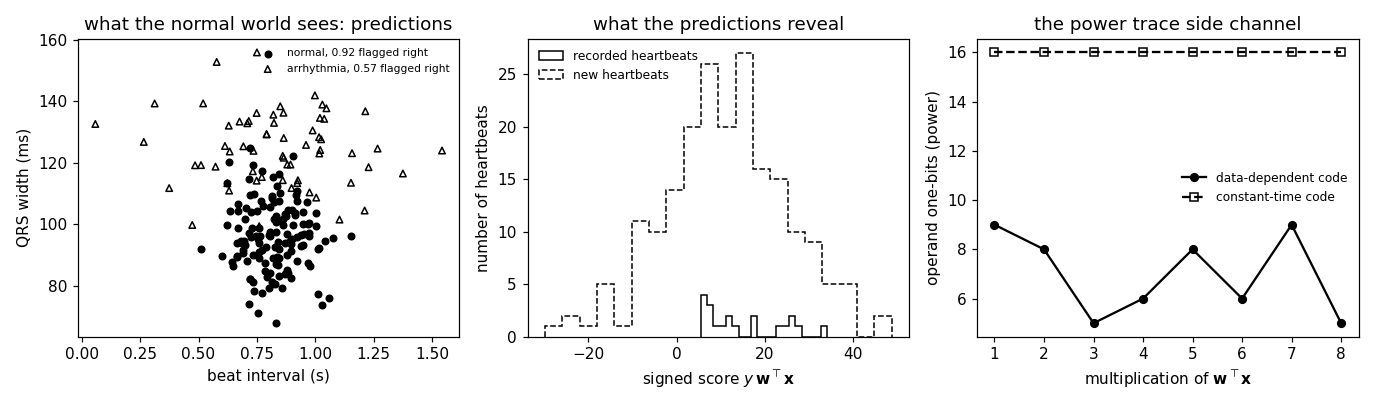
Models the entry's Raspberry Pi in a clinic: a secure world that holds the model parameters of a learned hypothesis and the recorded heartbeats, a normal world that sees only the predictions, remote attestation by a signed digest of the code, and the two things a TEE does not protect by itself -- what the predictions reveal, and the side channel of a power trace.
 unsupervised learning
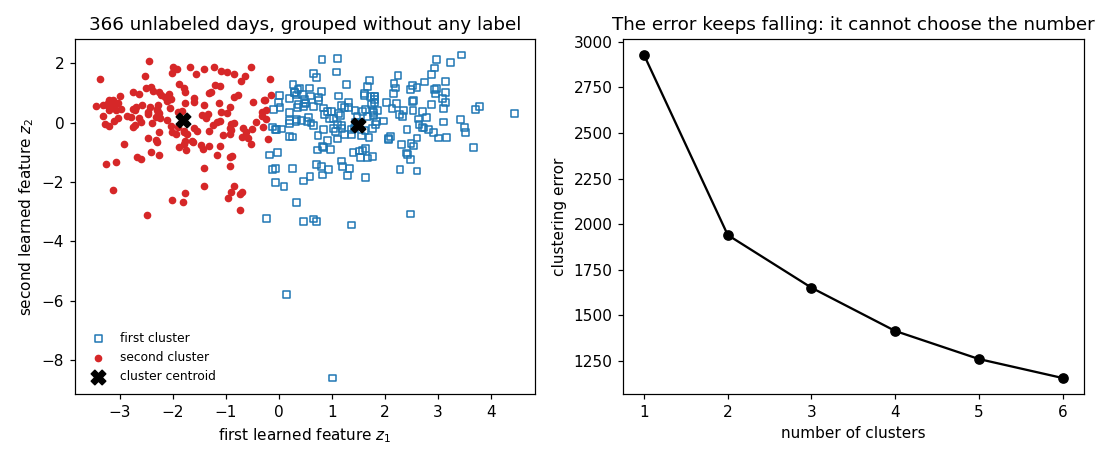
Numerical companion to the glossary entry 'unsupervisedlearning'.
 validation error
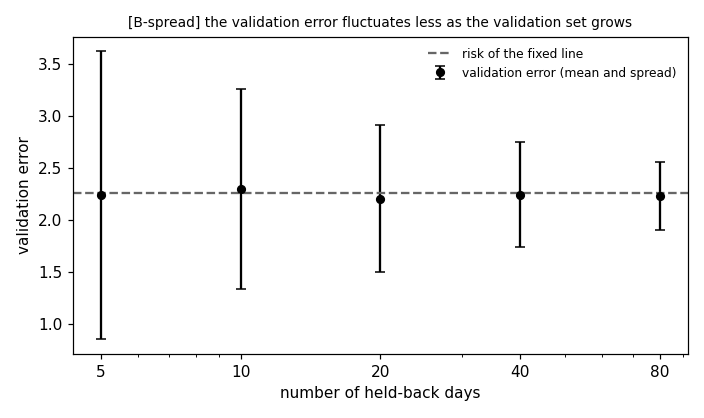
The entry's weather narrative, carried out on the record itself: the daily minimum and maximum air temperature at Krems an der Donau for all 366 days of 2024 (GeoSphere Austria, station 3805, dataset klima-v2-1d).
 validation set
The weather narrative of the 'training set' entry, continued: the same three training days and the same two hypotheses (straight line, degree-two polynomial), plus three validation days held back from model training.
 variance
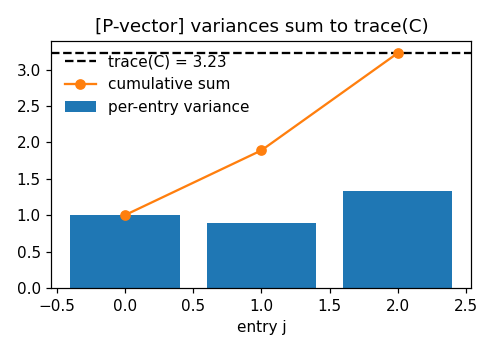
One block per paragraph of the entry (marked [P...]): each block verifies numerically what the corresponding statement asserts.