B-permute writes when the script runsDictionary of Applied Machine Learning · feature importance
Numerical companion to the entry feature importance: it recomputes what the entry states and prints one line per check
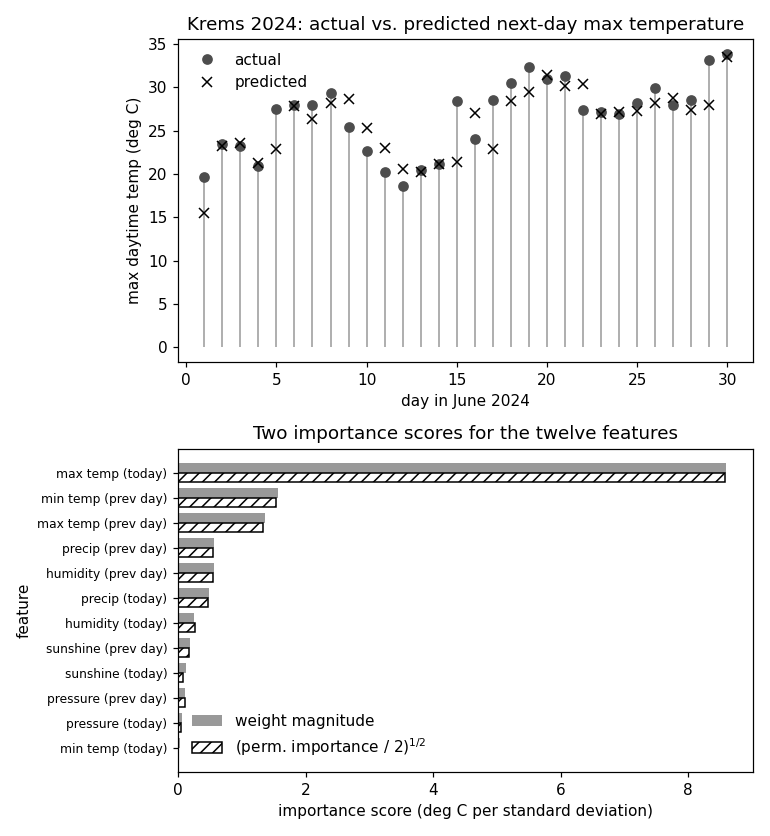
Numerical companion to the glossary entry 'featureimportance'. The GeoSphere Austria weather station Krems (station id 3805, 48.42 N, 15.62 E) records six daily observations: maximum and minimum air temperature, mean air pressure, mean relative humidity, sunshine duration and precipitation. This script downloads the records for all 366 days of 2024 (dataset klima-v2-1d) and predicts the maximum daytime temperature of the next day from the twelve observations of the current and the previous day. A linear hypothesis learned by linear regression on the standardized features reaches an average squared error loss of 8.78 (squared degrees C) against a label variance of 84.59. Two importance scores are then computed for each of the twelve features: the magnitude of its learned weight, and its permutation importance (the increase of the average squared error loss when the feature's values are randomly permuted across the data points). Both scores agree: today's maximum temperature carries almost all of the credit, and the permutation importance matches its theoretical value of twice the squared weight. Today's minimum temperature obtains a weight magnitude of 0.02 and a permutation importance of 0.00: the predictions do not rest on it.
Run it with python3 featureimportance.py, from any directory — it writes its output files into the current directory. Requires NumPy and Matplotlib only, and uses fixed seeds, so the printed numbers reproduce exactly. Download featureimportance.py · Notebook · Open in Colab
One cell per block of the script: the code, and what that code printed when it last ran here
"""Feature importance for a next-day temperature forecast at Krems an der
Donau: which of today's and the previous day's weather observations does
a learned linear hypothesis actually use?

Purpose
-------
Numerical companion to the glossary entry 'featureimportance'.  The
GeoSphere Austria weather station Krems (station id 3805, 48.42 N,
15.62 E) records six daily observations: maximum and minimum air
temperature, mean air pressure, mean relative humidity, sunshine
duration and precipitation.  This script downloads the records for all
366 days of 2024 (dataset klima-v2-1d) and predicts the maximum
daytime temperature of the next day from the twelve observations of
the current and the previous day.  A linear hypothesis learned by
linear regression on the standardized features reaches an average squared
error loss of 8.78 (squared degrees C) against a label variance of
84.59.  Two importance scores are then computed for each of the twelve
features: the magnitude of its learned weight, and its permutation
importance (the increase of the average squared error loss when the
feature's values are randomly permuted across the data points).  Both
scores agree: today's maximum temperature carries almost all of the
credit, and the permutation importance matches its theoretical value
of twice the squared weight.  Today's minimum temperature obtains a
weight magnitude of 0.02 and a permutation importance of 0.00: the
predictions do not rest on it.

Deterministic: the linear hypothesis is the closed-form solution of
linear regression; the permutations use a fixed seed.  Self-contained: numpy +
matplotlib only (stdlib urllib for the download).

Blocks
------
[B-fetch]   Download the six daily observations at Krems for 2024 from
            the GeoSphere data hub; write the 366 records to
            featureimportance_weather.csv and pin them to the archive.
[B-model]   Build 364 data points (features: the twelve observations of
            the current and the previous day, standardized; label: the
            maximum daytime temperature of the next day); learn a
            linear hypothesis by linear regression; write the actual and
            predicted values for June 2024 to featureimportance_stem.csv.
[B-weights] Score each feature by the magnitude of its learned weight;
            today's maximum temperature dominates with 8.60, today's
            minimum temperature is last with 0.02.
[B-permute] Score each feature by its permutation importance (20
            permutation rounds, fixed seed); check that it matches
            twice the squared weight for the three largest weights;
            write both scores to featureimportance_importance.csv.

Outputs
-------
featureimportance_weather.csv    : date + six observations, 366 days
featureimportance_stem.csv       : day, actual, predicted (June 2024)
featureimportance_importance.csv : idx, label, wabs, pisqrt (ascending
                                   by weight magnitude, so the largest
                                   score sits on top of an xbar chart)
featureimportance.png            : preview (checking only) -- the June
                                   stem plot and both importance scores
"""

import json
import urllib.request
from pathlib import Path

import numpy as np
import matplotlib

matplotlib.use("Agg")
import matplotlib.pyplot as plt

OUT_DIR = Path(__file__).parent

report = []                         # collects (check name, pass/fail) pairs


def check(name, ok):                # records and prints one verification
    report.append((name, bool(ok)))
    print(f"  [{'ok' if ok else 'FAIL'}] {name}")
Download the six daily observations at Krems for 2024 from the GeoSphere data hub; write the 366 records to featureimportance_weather.csv and pin them to the archive.
PARAMS = ["tlmax", "tlmin", "p_mittel", "rf_mittel", "so_h", "rr"]
URL = ("https://dataset.api.hub.geosphere.at/v1/station/historical/"
       f"klima-v2-1d?parameters={','.join(PARAMS)}&station_ids=3805"
       "&start=2024-01-01&end=2024-12-31")
with urllib.request.urlopen(URL, timeout=120) as resp:
    payload = json.load(resp)
cols = payload["features"][0]["properties"]["parameters"]
days = [stamp[:10] for stamp in payload["timestamps"]]
raw = np.array([cols[p]["data"] for p in PARAMS], dtype=float).T
with open(OUT_DIR / "featureimportance_weather.csv", "w") as f:
    f.write("date," + ",".join(PARAMS) + "\n")
    for day, row in zip(days, raw):
        f.write(day + "," + ",".join(f"{v:g}" for v in row) + "\n")
check("[B-fetch] 366 days downloaded for 2024", len(days) == 366)
check("[B-fetch] no observation is missing", not np.isnan(raw).any())
check("[B-fetch] the record matches the archive (Jan 1: 9.6, 2.6, "
      "988.3, 67, 4.0, 0.0)",
      raw[0].tolist() == [9.6, 2.6, 988.3, 67.0, 4.0, 0.0])
raw[:, 5] = np.maximum(raw[:, 5], 0.0)   # the archive codes trace
# precipitation as -1.0 mm; a negative rainfall amount is a code, not a
# measurement, so it is set to zero
  [ok] [B-fetch] 366 days downloaded for 2024
  [ok] [B-fetch] no observation is missing
  [ok] [B-fetch] the record matches the archive (Jan 1: 9.6, 2.6, 988.3, 67, 4.0, 0.0)
  average squared error loss 8.78, label variance 84.59
Build 364 data points (features: the twelve observations of the current and the previous day, standardized; label: the maximum daytime temperature of the next day); learn a linear hypothesis by linear regression; write the actual and predicted values for June 2024 to featureimportance_stem.csv.
OBS = ["max temp", "min temp", "pressure", "humidity", "sunshine", "precip"]
labels = ([f"{o} (today)" for o in OBS]
          + [f"{o} (prev day)" for o in OBS])
feats = np.array([np.concatenate([raw[t], raw[t - 1]])
                  for t in range(1, len(raw) - 1)])
y = raw[2:, 0]                       # tlmax of the following day
feats = (feats - feats.mean(0)) / feats.std(0)
A = np.hstack([feats, np.ones((len(feats), 1))])
w, *_ = np.linalg.lstsq(A, y, rcond=None)
pred = A @ w
mse = float(np.mean((y - pred) ** 2))
var = float(np.mean((y - y.mean()) ** 2))
print(f"  average squared error loss {mse:.2f}, label variance {var:.2f}")
check("[B-model] 364 data points with 12 features each",
      feats.shape == (364, 12))
check("[B-model] the learned hypothesis reaches average loss 8.78",
      round(mse, 2) == 8.78)
check("[B-model] the label variance is 84.59", round(var, 2) == 84.59)

june = [i for i, t in enumerate(range(1, len(raw) - 1))
        if days[t + 1].startswith("2024-06")]
with open(OUT_DIR / "featureimportance_stem.csv", "w") as f:
    f.write("day,actual,predicted\n")
    for n, i in enumerate(june, start=1):
        f.write(f"{n},{y[i]:.1f},{pred[i]:.1f}\n")
check("[B-model] the stem plot covers the 30 days of June 2024",
      len(june) == 30)
  [ok] [B-model] 364 data points with 12 features each
  [ok] [B-model] the learned hypothesis reaches average loss 8.78
  [ok] [B-model] the label variance is 84.59
  [ok] [B-model] the stem plot covers the 30 days of June 2024
  |weight| max temp (today)        8.60
  |weight| min temp (prev day)     1.56
  |weight| max temp (prev day)     1.37
  |weight| precip (prev day)       0.56
  |weight| humidity (prev day)     0.56
  |weight| precip (today)          0.48
  |weight| humidity (today)        0.26
  |weight| sunshine (prev day)     0.18
  |weight| sunshine (today)        0.12
  |weight| pressure (prev day)     0.11
  |weight| pressure (today)        0.07
  |weight| min temp (today)        0.02
Score each feature by the magnitude of its learned weight; today's maximum temperature dominates with 8.60, today's minimum temperature is last with 0.02.
wabs = np.abs(w[:12])
order = np.argsort(wabs)             # ascending: largest ends up on top
for i in order[::-1]:
    print(f"  |weight| {labels[i]:22s} {wabs[i]:5.2f}")
check("[B-weights] the largest weight magnitude is today's max temp, 8.60",
      labels[int(order[-1])] == "max temp (today)"
      and round(float(wabs[order[-1]]), 2) == 8.60)
check("[B-weights] the smallest weight magnitude is today's min temp, 0.02",
      labels[int(order[0])] == "min temp (today)"
      and round(float(wabs[order[0]]), 2) == 0.02)
  [ok] [B-weights] the largest weight magnitude is today's max temp, 8.60
  [ok] [B-weights] the smallest weight magnitude is today's min temp, 0.02
  perm. importance max temp (today)        147.21
  perm. importance min temp (prev day)       4.75
  perm. importance max temp (prev day)       3.58
  perm. importance precip (prev day)         0.61
  perm. importance humidity (prev day)       0.61
  perm. importance precip (today)            0.45
  perm. importance humidity (today)          0.14
  perm. importance sunshine (prev day)       0.06
  perm. importance sunshine (today)          0.01
  perm. importance pressure (prev day)       0.02
  perm. importance pressure (today)          0.01
  perm. importance min temp (today)         -0.00
Score each feature by its permutation importance (20 permutation rounds, fixed seed); check that it matches twice the squared weight for the three largest weights; write both scores to featureimportance_importance.csv.
rng = np.random.default_rng(0)
perm = np.zeros(12)
for j in range(12):
    inc = []
    for _ in range(20):
        Ap = A.copy()
        Ap[:, j] = rng.permutation(Ap[:, j])
        inc.append(float(np.mean((y - Ap @ w) ** 2)) - mse)
    perm[j] = np.mean(inc)
pisqrt = np.sqrt(np.maximum(perm, 0.0) / 2.0)
for i in order[::-1]:
    print(f"  perm. importance {labels[i]:22s} {perm[i]:7.2f}")
check("[B-permute] the largest permutation importance is today's max "
      "temp, 147.21", round(float(perm[int(order[-1])]), 2) == 147.21)
check("[B-permute] today's min temp has permutation importance 0.00",
      round(float(perm[int(order[0])]), 2) == 0.00)
check("[B-permute] the importance matches twice the squared weight "
      "(within 0.1 after sqrt) for the three largest weights",
      all(abs(pisqrt[i] - wabs[i]) < 0.1 for i in order[-3:]))
with open(OUT_DIR / "featureimportance_importance.csv", "w") as f:
    f.write("idx,label,wabs,pisqrt\n")
    for n, i in enumerate(order):
        f.write(f"{n},{labels[i]},{wabs[i]:.2f},{pisqrt[i]:.2f}\n")

# ---- preview figure (checking only; the entry reads the CSVs)
fig, (ax1, ax2) = plt.subplots(2, 1, figsize=(7.0, 7.6))
d = np.arange(1, 31)
ya = np.array([y[i] for i in june])
yp = np.array([pred[i] for i in june])
ax1.vlines(d, 0, ya, color="0.6", linewidth=1)
ax1.plot(d, ya, "o", color="0.3", label="actual")
ax1.plot(d, yp, "x", color="black", markersize=7, label="predicted")
ax1.set_xlabel("day in June 2024")
ax1.set_ylabel("max daytime temp (deg C)")
ax1.set_title("Krems 2024: actual vs. predicted next-day max temperature")
ax1.legend(frameon=False)
pos = np.arange(12)
ax2.barh(pos + 0.19, wabs[order], height=0.38, color="0.6",
         label="weight magnitude")
ax2.barh(pos - 0.19, pisqrt[order], height=0.38, color="white",
         edgecolor="black", hatch="///",
         label="(perm. importance / 2)$^{1/2}$")
ax2.set_yticks(pos)
ax2.set_yticklabels([labels[i] for i in order], fontsize=8)
ax2.set_xlabel("importance score (deg C per standard deviation)")
ax2.set_ylabel("feature")
ax2.set_title("Two importance scores for the twelve features")
ax2.legend(frameon=False)
fig.tight_layout()
fig.savefig(OUT_DIR / "featureimportance.png", dpi=110)

failed = [name for name, ok in report if not ok]
print(f"{len(report) - len(failed)}/{len(report)} checks passed"
      + (f"; FAILED: {failed}" if failed else ""))
  [ok] [B-permute] the largest permutation importance is today's max temp, 147.21
  [ok] [B-permute] today's min temp has permutation importance 0.00
  [ok] [B-permute] the importance matches twice the squared weight (within 0.1 after sqrt) for the three largest weights
12/12 checks passed
B-permute writes when the script runs