B-limit writes when the script runsDictionary of Applied Machine Learning · ensemble
Numerical companion to the entry ensemble: it recomputes what the entry states and prints one line per check
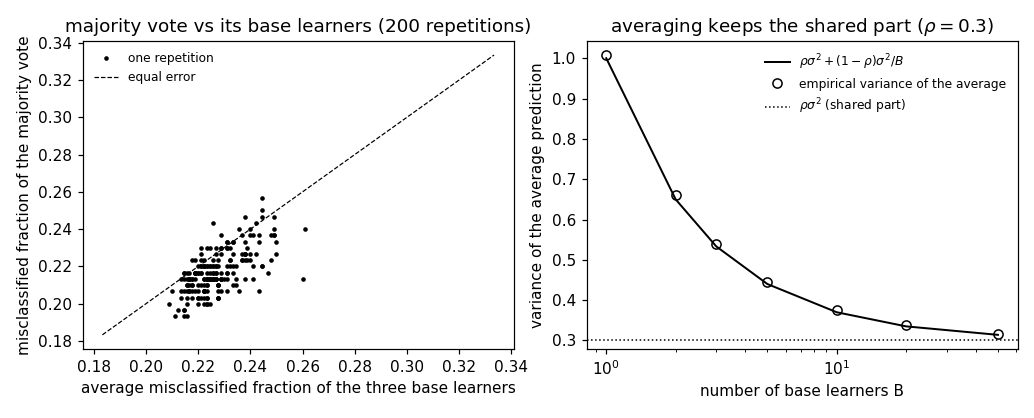
Backs the entry's two quantitative claims. First, a majority vote of three different classifiers over patches of an aerial photograph (vineyard or not) misclassifies fewer patches than any single one of them. Second, the average of B identically distributed predictions with variance sigma^2 and pairwise correlation rho has variance rho sigma^2 + (1 - rho) sigma^2 / B: the second term vanishes as B grows, the first remains. Self-contained (numpy/matplotlib only), fixed seed.
Run it without installing anything:uv run https://dictionaryofml.org/terms/ensemble.py
uv downloads this script and the pinned NumPy and Matplotlib it needs, then runs it; the script fetches any input file it uses. To keep the output files, download ensemble.py into a folder and run uv run ensemble.py there. With NumPy and Matplotlib already installed, python3 ensemble.py, from any directory — it writes its output files into the current directory. Fixed seeds, so the printed numbers reproduce exactly. Download ensemble.py · Notebook · Open in Colab
One cell per block of the script: the code, and what that code printed when it last ran here
"""
ensemble.py — numerical companion to the glossary entry 'ensemble'.

Purpose
-------
Backs the entry's two quantitative claims.  First, a majority vote of
three different classifiers over patches of an aerial photograph
(vineyard or not) misclassifies fewer patches than any single one of
them.  Second, the average of B identically distributed predictions with
variance sigma^2 and pairwise correlation rho has variance
rho sigma^2 + (1 - rho) sigma^2 / B: the second term vanishes as B grows,
the first remains.  Self-contained (numpy/matplotlib only), fixed seed.

Setup
-----
Patches: 600 labelled patches with two features, a color score and a
texture score, drawn around two overlapping centers (vineyard / not);
the label is flipped for 8 percent of the patches.  300 patches form
the training set, the other 300 are kept for measuring the misclassified
fraction.  Three base learners, each a decision tree with two levels of
splits, each trained on its own random subset of 120 training patches,
so that their errors are only partly shared.  The aggregation rule is
the majority vote.

Blocks
------
[B-vote]  Over 200 repetitions with fresh random subsets, the majority
          vote misclassifies fewer of the 300 held-back patches, on
          average, than a single base learner, and it beats the average
          of its three base learners in at least 80 percent of the
          repetitions.
[B-var]   For sigma^2 = 1 and rho = 0.3, the empirical variance of the
          average of B predictions, over 20000 draws, matches
          rho sigma^2 + (1 - rho) sigma^2 / B within 5 percent for every
          B in {1, 2, 3, 5, 10, 20, 50}.
[B-limit] At B = 50 the variance of the average is within 10 percent of
          rho sigma^2 = 0.3: the correlated part is what averaging
          cannot remove.

Outputs
-------
ensemble_vote.csv     : one row per repetition: misclassified fraction
                        of the three base learners and of the majority
                        vote.
ensemble_variance.csv : B, empirical variance of the average, and the
                        formula value.
ensemble.png          : matplotlib preview (checking only).
"""

import numpy as np
import matplotlib

matplotlib.use("Agg")
import matplotlib.pyplot as plt

from pathlib import Path

OUT_DIR = Path(__file__).parent

report = []


def check(name, ok):
    report.append((name, bool(ok)))
    print(f"  [{'ok' if ok else 'FAIL'}] {name}")


rng = np.random.default_rng(0)

# ---------------------------------------------------------------- patches
n = 600
y = rng.integers(0, 2, n)                                  # 1 = vineyard
centers = np.array([[0.35, 0.35], [0.65, 0.65]])
X = centers[y] + 0.17 * rng.standard_normal((n, 2))       # color, texture
flip = rng.random(n) < 0.08
y = np.where(flip, 1 - y, y)
tr = np.arange(n) < 300
X_tr, y_tr, X_te, y_te = X[tr], y[tr], X[~tr], y[~tr]


def best_split(Xs, ys, j):
    """Threshold on feature j that misclassifies fewest patches, with the
    class assigned to each side; returns (threshold, left class, right class,
    misclassified count)."""
    order = np.argsort(Xs[:, j]); v = Xs[order, j]; lab = ys[order]
    best = (None, 0, 1, len(ys) + 1)
    for k in range(1, len(v)):
        if v[k] == v[k - 1]:
            continue
        thr = 0.5 * (v[k] + v[k - 1])
        left, right = lab[:k], lab[k:]
        lc = int(left.mean() >= 0.5); rc = int(right.mean() >= 0.5)
        err = int((left != lc).sum() + (right != rc).sum())
        if err < best[3]:
            best = (thr, lc, rc, err)
    return best


def stump(Xs, ys, j):
    thr, lc, rc, _ = best_split(Xs, ys, j)
    return lambda Z: np.where(Z[:, j] <= thr, lc, rc)


def tree2(Xs, ys):
    """Two levels of splits: the better feature at the root, then the
    better feature on each side."""
    cands = [best_split(Xs, ys, j) for j in (0, 1)]
    j0 = int(np.argmin([c[3] for c in cands])); thr0 = cands[j0][0]
    left = Xs[:, j0] <= thr0
    subs = []
    for side in (left, ~left):
        cs = [best_split(Xs[side], ys[side], j) for j in (0, 1)]
        j1 = int(np.argmin([c[3] for c in cs])); subs.append((j1, cs[j1]))

    def predict(Z):
        out = np.empty(len(Z), dtype=int)
        for side, (j1, (thr, lc, rc, _)) in zip((Z[:, j0] <= thr0, Z[:, j0] > thr0), subs):
            out[side] = np.where(Z[side, j1] <= thr, lc, rc)
        return out
    return predict
Over 200 repetitions with fresh random subsets, the majority vote misclassifies fewer of the 300 held-back patches, on average, than a single base learner, and it beats the average of its three base learners in at least 80 percent of the repetitions.
reps = 200
rows = []
for _ in range(reps):
    learners = []
    for _ in range(3):
        idx = rng.choice(300, 120, replace=False)          # own random subset
        learners.append(tree2(X_tr[idx], y_tr[idx]))
    votes = np.stack([h(X_te) for h in learners])          # 3 x 300
    errs = [float((v != y_te).mean()) for v in votes]
    vote = (votes.sum(axis=0) >= 2).astype(int)
    rows.append(errs + [float((vote != y_te).mean())])
rows = np.array(rows)
mean_single, mean_vote = float(rows[:, :3].mean()), float(rows[:, 3].mean())
wins = float((rows[:, 3] < rows[:, :3].mean(axis=1)).mean())
check(f"[B-vote]  misclassified fraction over {reps} repetitions: single base "
      f"learner {mean_single:.3f} on average, majority vote {mean_vote:.3f}; the "
      f"vote beats its base learners' average in {100 * wins:.0f}% of them",
      mean_vote < mean_single and wins >= 0.8)
[ok] [B-vote] misclassified fraction over 200 repetitions: single base learner 0.227 on average, majority vote 0.218; the vote beats its base learners' average in 84% of them
For sigma^2 = 1 and rho = 0.3, the empirical variance of the average of B predictions, over 20000 draws, matches rho sigma^2 + (1 - rho) sigma^2 / B within 5 percent for every B in {1, 2, 3, 5, 10, 20, 50}.
sigma2, rho, draws = 1.0, 0.3, 20000
Bs = [1, 2, 3, 5, 10, 20, 50]
emp, formula = [], []
for B in Bs:
    shared = rng.standard_normal((draws, 1)) * np.sqrt(rho * sigma2)
    own = rng.standard_normal((draws, B)) * np.sqrt((1 - rho) * sigma2)
    avg = (shared + own).mean(axis=1)                      # correlation rho
    emp.append(float(avg.var())); formula.append(rho * sigma2 + (1 - rho) * sigma2 / B)
dev = max(abs(e - f) / f for e, f in zip(emp, formula))
check(f"[B-var]   variance of the average vs rho s^2 + (1-rho) s^2/B: "
      f"largest relative deviation {dev:.3f}", dev < 0.05)
[ok] [B-var] variance of the average vs rho s^2 + (1-rho) s^2/B: largest relative deviation 0.016
At B = 50 the variance of the average is within 10 percent of rho sigma^2 = 0.3: the correlated part is what averaging cannot remove.
check(f"[B-limit] at B=50 the variance is {emp[-1]:.3f}, the correlated part "
      f"rho s^2 = {rho * sigma2:.1f} remains", abs(emp[-1] - rho * sigma2) < 0.1 * rho * sigma2)

# ---------------------------------------------------------------- CSV
with open(OUT_DIR / "ensemble_vote.csv", "w") as fh:
    fh.write("rep,tree1,tree2,tree3,vote\n")
    for k, r in enumerate(rows):
        fh.write(f"{k},{r[0]:.4f},{r[1]:.4f},{r[2]:.4f},{r[3]:.4f}\n")
with open(OUT_DIR / "ensemble_variance.csv", "w") as fh:
    fh.write("B,empirical,formula\n")
    for B, e, f in zip(Bs, emp, formula):
        fh.write(f"{B},{e:.4f},{f:.4f}\n")

# -------------------------------------------------------------- preview
fig, (ax, ax2) = plt.subplots(1, 2, figsize=(9.4, 3.8))
ax.plot(rows[:, :3].mean(axis=1), rows[:, 3], "k.", ms=4, label="one repetition")
lim = [rows.min() - 0.01, rows.max() + 0.01]
ax.plot(lim, lim, "k--", lw=0.8, label="equal error")
ax.set_xlabel("average misclassified fraction of the three base learners")
ax.set_ylabel("misclassified fraction of the majority vote")
ax.set_title("majority vote vs its base learners (200 repetitions)")
ax.legend(frameon=False, fontsize=8)
ax2.plot(Bs, formula, "k-", lw=1.3, label=r"$\rho\sigma^2 + (1-\rho)\sigma^2/B$")
ax2.plot(Bs, emp, "ko", mfc="none", ms=6, label="empirical variance of the average")
ax2.axhline(rho * sigma2, color="k", ls=":", lw=1, label=r"$\rho\sigma^2$ (shared part)")
ax2.set_xscale("log"); ax2.set_xlabel("number of base learners B"); ax2.set_ylabel("variance of the average prediction")
ax2.set_title(r"averaging keeps the shared part ($\rho = 0.3$)")
ax2.legend(frameon=False, fontsize=8)
fig.tight_layout()
fig.savefig(OUT_DIR / "ensemble.png", dpi=110)

n_ok = sum(ok for _, ok in report)
print(f"\n{n_ok}/{len(report)} checks pass")
print(f"wrote {OUT_DIR / 'ensemble_vote.csv'}, {OUT_DIR / 'ensemble_variance.csv'}, "
      f"{OUT_DIR / 'ensemble.png'}")
if n_ok != len(report):
    raise SystemExit(1)
  [ok] [B-limit] at B=50 the variance is 0.316, the correlated part rho s^2 = 0.3 remains

3/3 checks pass
wrote /Users/junga1/dictionaryappliedml/pythondemos/ensemble_vote.csv, /Users/junga1/dictionaryappliedml/pythondemos/ensemble_variance.csv, /Users/junga1/dictionaryappliedml/pythondemos/ensemble.png
B-limit writes when the script runs