P-types writes when the script runsDictionary of Applied Machine Learning · random variable (RV)
Numerical companion to the entry random variable (RV): it recomputes what the entry states and prints one line per check
One block per paragraph of the entry (marked [P...]), in order: each block verifies numerically what the corresponding paragraph asserts. Self-contained (numpy/matplotlib only), fixed seed.
Run it without installing anything:uv run https://dictionaryofml.org/terms/rv.py
uv downloads this script and the pinned NumPy and Matplotlib it needs, then runs it; the script fetches any input file it uses. To keep the output files, download rv.py into a folder and run uv run rv.py there. With NumPy and Matplotlib already installed, python3 rv.py, from any directory — it writes its output files into the current directory. Fixed seeds, so the printed numbers reproduce exactly. Download rv.py · Notebook · Open in Colab
One cell per block of the script: the code, and what that code printed when it last ran here
"""
rv.py — numerical companion to the glossary entry 'random variable (RV)'.

One block per paragraph of the entry (marked [P...]), in order: each block
verifies numerically what the corresponding paragraph asserts. Self-contained
(numpy/matplotlib only), fixed seed.

Blocks
------
[P-weather] The maximum daytime temperature in Krems, read at 13:00, is a
            real-valued RV; each day is one outcome of a random experiment and
            the recorded temperature is a single realization. Thirty days are
            modeled as iid RVs with a common distribution; the realizations are
            written to rv_stem.csv for the entry's stem-plot figure.
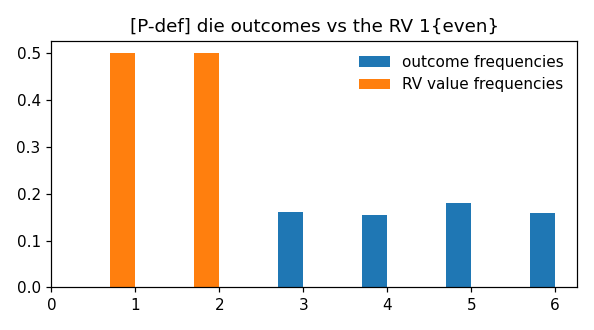
[P-def]     An RV is a function on the sample space of a random experiment: for
            a fair-die experiment (sample space {1,...,6}) the RV
            x(omega) = 1{omega is even} is an explicit function; simulating the
            experiment and applying the function reproduces the probability
            P(x = 1) = 1/2 implied by the uniform distribution on the sample
            space.
[P-types]   The types listed in the entry — binary RV, discrete RV, real-valued
            RV, random vector, random matrix — are instantiated as functions of
            the same underlying experiment, with values in {0, 1}, a countable
            set, R, R^d, and R^{m x d}, respectively.

Outputs
-------
rv_stem.csv : figure data for the entry's pgfplots stem plot (day, temp).
rv.png      : preview figure (checking only).

Data generated by pythondemos/rv.py.
"""

import numpy as np
import matplotlib

matplotlib.use("Agg")
import matplotlib.pyplot as plt
from pathlib import Path

OUT_DIR = Path(__file__).parent

rng = np.random.default_rng(42)
report = []


def check(name, ok):
    report.append((name, bool(ok)))
    print(f"  [{'ok' if ok else 'FAIL'}] {name}")
The maximum daytime temperature in Krems, read at 13:00, is a real-valued RV; each day is one outcome of a random experiment and the recorded temperature is a single realization. Thirty days are modeled as iid RVs with a common distribution; the realizations are written to rv_stem.csv for the entry's stem-plot figure.
print("[P-weather] daily 13:00 temperatures as realizations of a real-valued RV")
mu, sigma = 20.0, 4.0                 # center and spread of the common distribution (degC)
n_days = 30
days = np.arange(1, n_days + 1)
temps = mu + sigma * rng.standard_normal(n_days)
np.savetxt(OUT_DIR / "rv_stem.csv",
           np.column_stack([days, temps]),
           fmt=["%d", "%.3f"], delimiter=",",
           header="day,temp", comments="")
check("one realization written per day", days.size == n_days)
check("every realization is a finite real number", np.all(np.isfinite(temps)))
[P-weather] daily 13:00 temperatures as realizations of a real-valued RV
  [ok] one realization written per day
  [ok] every realization is a finite real number
An RV is a function on the sample space of a random experiment: for a fair-die experiment (sample space {1,...,6}) the RV x(omega) = 1{omega is even} is an explicit function; simulating the experiment and applying the function reproduces the probability P(x = 1) = 1/2 implied by the uniform distribution on the sample space.
print("[P-def] an RV is a function on the sample space")
sample_space = np.arange(1, 7)                   # fair die
x_of = lambda omega: (omega % 2 == 0).astype(int)  # RV: even -> 1
outcomes = rng.choice(sample_space, size=10**6)  # run the experiment
x_real = x_of(outcomes)                          # realizations of the RV
check("x is a deterministic function of the outcome",
      np.array_equal(x_real, x_of(outcomes)))
check("P(x = 1) = 1/2 from the uniform experiment",
      abs(x_real.mean() - 0.5) < 2e-3)
check("the same outcome always maps to the same value",
      x_of(np.array([4]))[0] == 1 and x_of(np.array([3]))[0] == 0)
[P-def] an RV is a function on the sample space
  [ok] x is a deterministic function of the outcome
  [ok] P(x = 1) = 1/2 from the uniform experiment
  [ok] the same outcome always maps to the same value
The types listed in the entry — binary RV, discrete RV, real-valued RV, random vector, random matrix — are instantiated as functions of the same underlying experiment, with values in {0, 1}, a countable set, R, R^d, and R^{m x d}, respectively.
print("[P-types] binary / discrete / real-valued / vector / matrix RVs")
omega = rng.uniform(size=10**4)                  # one underlying experiment
binary = (omega > 0.5).astype(int)
discrete = np.floor(10 * omega).astype(int)      # values in {0,...,9}
realval = -np.log(omega)                         # values in R
vec = np.stack([omega, omega**2, np.sin(omega)], axis=1)      # R^3
mat = omega[:, None, None] * np.ones((1, 2, 3))               # R^{2x3}
check("binary RV takes values in {0, 1}",
      set(np.unique(binary)) <= {0, 1})
check("discrete RV takes values in a countable set",
      np.issubdtype(discrete.dtype, np.integer)
      and len(np.unique(discrete)) <= 10)
check("real-valued RV takes values in R (nonnegative here)",
      realval.dtype == float and np.all(realval >= 0))
check("random vector maps outcomes to R^3", vec.shape == (10**4, 3))
check("random matrix maps outcomes to R^{2x3}",
      mat.shape == (10**4, 2, 3))

# ------------------------------------------------------------ preview
# The temperatures, the die outcomes, and the RV values live on different
# sets, so they get one panel each: drawing them on shared x positions
# would hide one series.
fig, ax = plt.subplots(1, 3, figsize=(11.0, 3.0))
markerline, stemlines, baseline = ax[0].stem(days, temps)
plt.setp(markerline, markersize=4)
plt.setp(baseline, visible=False)
ax[0].set_xlabel("day")
ax[0].set_ylabel("temperature at 13:00 (degC)")
ax[0].set_title("[P-weather] daily 13:00 temperatures")
vals, counts = np.unique(outcomes[:600], return_counts=True)
ax[1].bar(vals, counts / 600, width=0.6, color="0.75", edgecolor="black")
ax[1].set_xticks(range(1, 7))
ax[1].set_xlabel("outcome of the die roll")
ax[1].set_ylabel("relative frequency")
ax[1].set_title("[P-def] the 6 outcomes")
ax[2].bar([0, 1], [np.mean(x_real == 0), np.mean(x_real == 1)],
          width=0.6, color="white", edgecolor="black", hatch="///")
ax[2].set_xticks([0, 1])
ax[2].set_xlabel("value of the RV 1{even}")
ax[2].set_ylabel("relative frequency")
ax[2].set_title("[P-def] the 2 values it takes")
fig.tight_layout()
fig.savefig(OUT_DIR / "rv.png", dpi=110)
print(f"\n{sum(ok for _, ok in report)}/{len(report)} checks passed")
assert all(ok for _, ok in report)
[P-types] binary / discrete / real-valued / vector / matrix RVs
  [ok] binary RV takes values in {0, 1}
  [ok] discrete RV takes values in a countable set
  [ok] real-valued RV takes values in R (nonnegative here)
  [ok] random vector maps outcomes to R^3
  [ok] random matrix maps outcomes to R^{2x3}

10/10 checks passed
P-types writes when the script runs