B-nofit writes when the script runsDictionary of Applied Machine Learning · bootstrap aggregating (bagging)
Numerical companion to the entry bootstrap aggregating (bagging): it recomputes what the entry states and prints one line per check
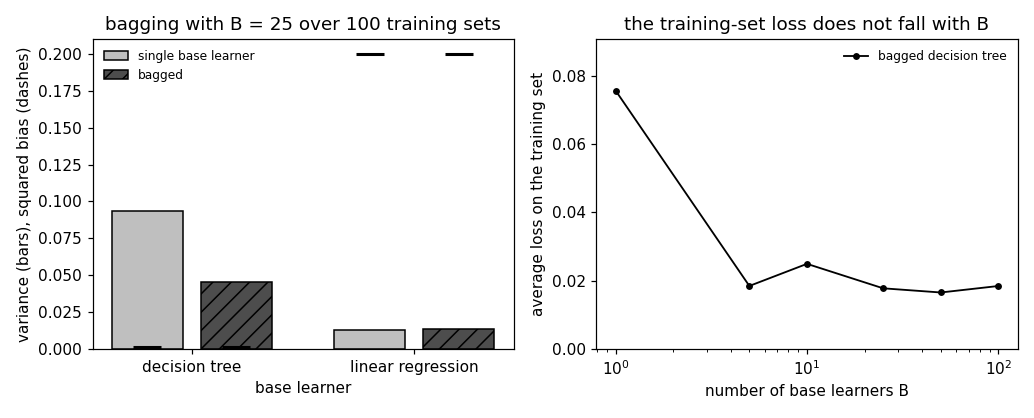
Backs the entry's claims with numbers: a decision tree grown until it reproduces every label changes its predictions noticeably when a handful of training points are replaced, while linear regression barely does; bagging reduces the variance of the tree's predictions and leaves its bias unchanged; it does little for linear regression; and adding more base learners does not make the aggregated hypothesis fit the training set more closely. Self-contained (numpy/matplotlib only), fixed seed.
Run it without installing anything:uv run https://dictionaryofml.org/terms/bagging.py
uv downloads this script and the pinned NumPy and Matplotlib it needs, then runs it; the script fetches any input file it uses. To keep the output files, download bagging.py into a folder and run uv run bagging.py there. With NumPy and Matplotlib already installed, python3 bagging.py, from any directory — it writes its output files into the current directory. Fixed seeds, so the printed numbers reproduce exactly. Download bagging.py · Notebook · Open in Colab
One cell per block of the script: the code, and what that code printed when it last ran here
"""
bagging.py — numerical companion to the glossary entry 'bootstrap
aggregating (bagging)'.

Purpose
-------
Backs the entry's claims with numbers: a decision tree grown until it
reproduces every label changes its predictions noticeably when a handful
of training points are replaced, while linear regression barely
does; bagging reduces the variance of the tree's predictions and leaves
its bias unchanged; it does little for linear regression; and adding
more base learners does not make the aggregated hypothesis fit the
training set more closely.  Self-contained (numpy/matplotlib only),
fixed seed.

Setup
-----
Regression with one feature x in [0, 1] and label
y = sin(2 pi x) + 0.3 x + noise (noise variance 0.09).  A training set
holds 50 points.  Base learners: a decision tree grown until every
leaf holds a single training point (so it reproduces every label) and linear
regression (a straight line).  Bagging draws B bootstrap resamples of
the training set, trains one base learner on each, and averages their
predictions.  Variance and bias are measured on a grid of 200 feature
values over 100 independent training sets.

Blocks
------
[B-unstable] Replacing 5 of the 50 training points, repeated 50 times,
             changes the tree's predictions by more than five times as
             much as linear regression's, measured by the largest change
             over the grid (the tree's change is local but large, the
             line's global but small).
[B-variance] Over 100 training sets, bagging with B = 25 lowers the
             variance of the tree's predictions by a factor above 2
             while its squared bias stays below 0.01 (as does the single
             tree's);
             for linear regression the variance drops by less than a
             factor 1.3.
[B-nofit]    The average loss of the bagged tree on its own training
             set does not fall toward zero as B grows: at B = 100 it is
             still above half of its value at B = 10, unlike for a
             method that accumulates its base learners.

Outputs
-------
bagging_variance.csv : per base learner: variance and squared bias of
                       the single and of the bagged (B = 25) predictions,
                       averaged over the grid.
bagging_trainloss.csv : B and the average loss of the bagged tree on
                       the training set.
bagging.png           : matplotlib preview (checking only).
"""

import numpy as np
import matplotlib

matplotlib.use("Agg")
import matplotlib.pyplot as plt

from pathlib import Path

OUT_DIR = Path(__file__).parent

report = []


def check(name, ok):
    report.append((name, bool(ok)))
    print(f"  [{'ok' if ok else 'FAIL'}] {name}")


rng = np.random.default_rng(0)
m = 50
grid = np.linspace(0.0, 1.0, 200)


def truth(x):
    return np.sin(2 * np.pi * x) + 0.3 * x


def draw_trainset(size=m):
    x = np.sort(rng.random(size))
    return x, truth(x) + 0.3 * rng.standard_normal(size)


# ------------------------------------------------------- base learners
def tree_fit(x, y):
    """Decision tree grown until every leaf holds one training point: a list
    of (threshold, value) leaves, i.e. a piecewise-constant map."""
    order = np.argsort(x); x, y = x[order], y[order]
    cuts = []

    def split(lo, hi):                       # indices lo..hi-1
        if hi - lo <= 1:
            return
        best, pos = None, None
        for k in range(lo + 1, hi):
            if x[k] == x[k - 1]:
                continue
            l, r = y[lo:k], y[k:hi]
            sse = ((l - l.mean()) ** 2).sum() + ((r - r.mean()) ** 2).sum()
            if best is None or sse < best:
                best, pos = sse, k
        if pos is None:
            return
        cuts.append(0.5 * (x[pos] + x[pos - 1]))
        split(lo, pos); split(pos, hi)
    split(0, len(x))
    cuts = np.sort(np.array(cuts))
    bins = np.searchsorted(cuts, x, side="right")
    values = np.array([y[bins == b].mean() for b in range(len(cuts) + 1)])
    return lambda z: values[np.searchsorted(cuts, z, side="right")]


def linreg_fit(x, y):
    w = np.polyfit(x, y, 1)
    return lambda z: np.polyval(w, z)


def bagged(fit, x, y, B):
    hs = []
    for _ in range(B):
        idx = rng.integers(0, len(x), len(x))             # bootstrap resample
        hs.append(fit(x[idx], y[idx]))
    return lambda z: np.mean([h(z) for h in hs], axis=0)
Replacing 5 of the 50 training points, repeated 50 times, changes the tree's predictions by more than five times as much as linear regression's, measured by the largest change over the grid (the tree's change is local but large, the line's global but small).
chg_tree, chg_lin = [], []
for _ in range(50):
    x0, y0 = draw_trainset()
    x1, y1 = x0.copy(), y0.copy()
    swap = rng.choice(m, 5, replace=False)                  # a handful
    x1[swap] = rng.random(5); y1[swap] = truth(x1[swap]) + 0.3 * rng.standard_normal(5)
    chg_tree.append(np.abs(tree_fit(x0, y0)(grid) - tree_fit(x1, y1)(grid)).max())
    chg_lin.append(np.abs(linreg_fit(x0, y0)(grid) - linreg_fit(x1, y1)(grid)).max())
chg_tree, chg_lin = float(np.mean(chg_tree)), float(np.mean(chg_lin))
check(f"[B-unstable] replacing 5 of 50 training points changes the tree's predictions "
      f"by up to {chg_tree:.2f} (average over 50 repetitions), linear regression's "
      f"by up to {chg_lin:.2f}", chg_tree > 5 * chg_lin)
[ok] [B-unstable] replacing 5 of 50 training points changes the tree's predictions by up to 0.86 (average over 50 repetitions), linear regression's by up to 0.09
Over 100 training sets, bagging with B = 25 lowers the variance of the tree's predictions by a factor above 2 while its squared bias stays below 0.01 (as does the single tree's); for linear regression the variance drops by less than a factor 1.3.
K, B = 100, 25
res = {}
for name, fit in (("tree", tree_fit), ("linreg", linreg_fit)):
    single, bag = [], []
    for _ in range(K):
        x, y = draw_trainset()
        single.append(fit(x, y)(grid)); bag.append(bagged(fit, x, y, B)(grid))
    single, bag = np.array(single), np.array(bag)
    res[name] = dict(
        var_single=float(single.var(axis=0).mean()), var_bag=float(bag.var(axis=0).mean()),
        bias_single=float(((single.mean(axis=0) - truth(grid)) ** 2).mean()),
        bias_bag=float(((bag.mean(axis=0) - truth(grid)) ** 2).mean()))
t, l = res["tree"], res["linreg"]
check(f"[B-variance] tree: variance {t['var_single']:.3f} -> {t['var_bag']:.3f} "
      f"(factor {t['var_single'] / t['var_bag']:.1f}), squared bias "
      f"{t['bias_single']:.3f} -> {t['bias_bag']:.3f}; linear regression: variance "
      f"{l['var_single']:.4f} -> {l['var_bag']:.4f} (factor {l['var_single'] / l['var_bag']:.2f})",
      t["var_single"] > 2 * t["var_bag"]
      and max(t["bias_bag"], t["bias_single"]) < 0.01
      and l["var_single"] < 1.3 * l["var_bag"])
[ok] [B-variance] tree: variance 0.094 -> 0.046 (factor 2.1), squared bias 0.001 -> 0.002; linear regression: variance 0.0127 -> 0.0133 (factor 0.95)
The average loss of the bagged tree on its own training set does not fall toward zero as B grows: at B = 100 it is still above half of its value at B = 10, unlike for a method that accumulates its base learners.
x, y = draw_trainset()
Bs = [1, 5, 10, 25, 50, 100]
train_loss = [float(np.mean((y - bagged(tree_fit, x, y, b)(x)) ** 2)) for b in Bs]
check("[B-nofit]    average loss of the bagged tree on its training set: "
      + ", ".join(f"B={b}: {v:.3f}" for b, v in zip(Bs, train_loss)),
      train_loss[-1] > 0.5 * train_loss[2])

# ---------------------------------------------------------------- CSV
with open(OUT_DIR / "bagging_variance.csv", "w") as fh:
    fh.write("learner,var_single,var_bagged,bias2_single,bias2_bagged\n")
    for name in ("tree", "linreg"):
        r = res[name]
        fh.write(f"{name},{r['var_single']:.4f},{r['var_bag']:.4f},"
                 f"{r['bias_single']:.4f},{r['bias_bag']:.4f}\n")
with open(OUT_DIR / "bagging_trainloss.csv", "w") as fh:
    fh.write("B,train_loss\n")
    for b, v in zip(Bs, train_loss):
        fh.write(f"{b},{v:.4f}\n")

# -------------------------------------------------------------- preview
from matplotlib.patches import Patch
fig, (ax, ax2) = plt.subplots(1, 2, figsize=(9.4, 3.8))
pos = np.array([0, 1, 2.5, 3.5])
vals = [t["var_single"], t["var_bag"], l["var_single"], l["var_bag"]]
bars = ax.bar(pos, vals, 0.8, color=["0.75", "0.3"] * 2, edgecolor="k")
for b in bars[1::2]:
    b.set_hatch("//")
ax.plot(pos[:2], [t["bias_single"], t["bias_bag"]], "k_", ms=18, mew=2)
ax.plot(pos[2:], [l["bias_single"], l["bias_bag"]], "k_", ms=18, mew=2)
ax.set_xticks([0.5, 3.0]); ax.set_xticklabels(["decision tree", "linear regression"])
ax.set_xlabel("base learner")
ax.set_ylabel("variance (bars), squared bias (dashes)")
ax.set_title("bagging with B = 25 over 100 training sets")
ax.legend(handles=[Patch(facecolor="0.75", edgecolor="k", label="single base learner"),
                   Patch(facecolor="0.3", edgecolor="k", hatch="//", label="bagged")],
          frameon=False, fontsize=8)
ax2.plot(Bs, train_loss, "k.-", lw=1.2, ms=7, label="bagged decision tree")
ax2.set_xscale("log")
ax2.set_xlabel("number of base learners B")
ax2.set_ylabel("average loss on the training set")
ax2.set_title("the training-set loss does not fall with B")
ax2.set_ylim(0, max(train_loss) * 1.2)
ax2.legend(frameon=False, fontsize=8)
fig.tight_layout()
fig.savefig(OUT_DIR / "bagging.png", dpi=110)

n_ok = sum(ok for _, ok in report)
print(f"\n{n_ok}/{len(report)} checks pass")
print(f"wrote {OUT_DIR / 'bagging_variance.csv'}, {OUT_DIR / 'bagging_trainloss.csv'}, "
      f"{OUT_DIR / 'bagging.png'}")
if n_ok != len(report):
    raise SystemExit(1)
  [ok] [B-nofit]    average loss of the bagged tree on its training set: B=1: 0.076, B=5: 0.018, B=10: 0.025, B=25: 0.018, B=50: 0.017, B=100: 0.018

3/3 checks pass
wrote /Users/junga1/dictionaryappliedml/pythondemos/bagging_variance.csv, /Users/junga1/dictionaryappliedml/pythondemos/bagging_trainloss.csv, /Users/junga1/dictionaryappliedml/pythondemos/bagging.png
B-nofit writes when the script runs