Dictionary of Applied Machine Learning
Updated on 2026-09-16
Typeset PDF version — the authoritative form of this entry
Python demo — a script that recomputes what this entry states and prints one line per check
A hypothesis is a map $\hypothesis: \featurespace \rightarrow \labelspace$ from the feature space $\featurespace$ to the label space $\labelspace$. Given a data point with features $\featurevec$, the hypothesis returns a prediction $\hypothesis(\featurevec)$ for the label $\truelabel$. A machine learning (ML) method selects a single learned hypothesis $\learnthypothesis$ from a restricted hypothesis space $\hypospace \subseteq \labelspace^{\featurespace}$. This restriction reflects finite computational resources of a practical ML method. As a case in point, an empirical risk minimization (ERM)-based method must be able to find a hypothesis minimizing the empirical risk on a training set. It does not examine the hypotheses one by one: gradient descent (GD) moves through a parametrized $\hypospace$ by following a gradient, which is possible only because $\hypospace$ carries that structure.
P-learnPredicting tomorrow's maximum daytime temperature
from today's morning temperature is a typical machine learning (ML)
task. A hypothesis is the
map that performs this prediction. Formally, a
hypothesis is a map (also called a function)
$\hypothesis: \featurespace \rightarrow \labelspace$
from the feature space $\featurespace$ to the
label space $\labelspace$
(Shalev-Shwartz and Ben-David, 2014, Sect. 2.1). Given a data point
with features $\featurevec$, the hypothesis $\hypothesis$
returns an estimate
$\predictedlabel = \hypothesis(\featurevec)$ of the
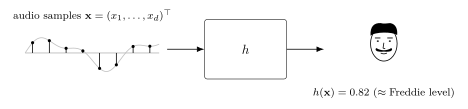
true label $\truelabel$. Fig. 1
illustrates this for an audio-based application where
the hypothesis predicts a Freddie-likeness score from
an audio recording.
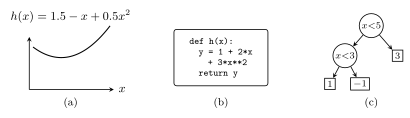
P-reprDifferent hypothesis spaces admit different representations
of their hypothesis maps. Polynomial regression (with a
single scalar feature $\feature$) represents each
$\hypothesis \in \hypospace$ as an algebraic expression
$\hypothesis(\feature) = \sum_{j=0}^{\polydegree} \weight_{j}
\feature^{j}$, with coefficients $\weight_{j}$ as the
model parameters. A hypothesis space of computer programs
represents $\hypothesis$ as executable source code, e.g., a
Python function with a prescribed signature.
A decision tree or an artificial neural network (ANN) represents $\hypothesis$
as a signal-flow chart whose nodes apply simple operations
(e.g., comparisons, weighted sums, nonlinear activations)
and whose edges define the order in which these operations are composed.
These representations differ in which functions
they can express and in how efficiently the ERM
problem can be solved over the corresponding $\hypospace$.
Fig. 2 shows the three
representations side by side.
See also: function, prediction, predictor, model, hypothesis space, feature vector, label, data point, empirical risk minimization, training, generalization.
@misc{dictml_hypothesis,
  author = {Jung, Alexander},
  editor = {Olioumtsevits, Konstantina and Schnoor, Ekkehard},
  title = {hypothesis},
  howpublished = {Dictionary of Applied Machine Learning (course edition)},
  year = {2026},
  doi = {10.5281/zenodo.21569296},
  note = {ISBN 978-952-64-3013-3, CC BY 4.0, retrieved 2026-09-21},
  url = {https://dictionaryofml.org/terms/hypothesis.html}
}