pythondemos/variance.pyDictionary of Applied Machine Learning
Updated on 2026-09-19
Typeset PDF version — the authoritative form of this entry
Python demo — a script that recomputes what this entry states and prints one line per check
The variance of a real-valued random variable (RV) is the expectation of the squared difference between the RV and its mean. It quantifies the spread of the probability distribution of the RV around the mean: a small variance means that realizations concentrate near the mean. The term also refers to the sample variance of a dataset; the two usages are consistent, since the sample variance is the variance of the RV obtained by drawing a data point uniformly from the dataset. Under the squared error loss, the variance is the smallest risk that a constant prediction of a numeric label can achieve. For a random vector, the variance is the expectation of the squared Euclidean norm of the deviation from the mean. This quantity equals the trace of the covariance matrix of the random vector, i.e., the sum of the variances of its entries.
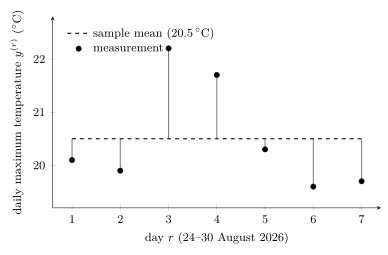
P-defThe Helsinki Kaisaniemi weather station recorded
daily maximum temperatures of $20.1$, $19.9$, $22.2$, $21.7$,
$20.3$, $19.6$ and $19.7\,^{\circ}$C on 24–30 August 2026
(Institute, 2026), and every reading lies within two degrees of
their average of $20.5\,^{\circ}$C. How far readings scatter
around their average is what the variance measures.
The variance of a real-valued random variable (RV) $\truelabel$
is the expectation $\expect\big\{ \big( \truelabel - \expect\{\truelabel \} \big)^{2} \big\}$ of
the squared difference between $\truelabel$ and its
expectation $\expect\{\truelabel \}$, also called its
mean.
Fig. 1 depicts the seven readings as
realizations of such an RV, together
with their sample mean and the deviation of each measurement
from it.
pythondemos/variance.py
P-minFor an RV with a finite second moment, i.e., $\expect\{ \truelabel^{2} \} < \infty$, the mean is the constant $\offset$ that minimizes the risk $\expect\{ ( \truelabel - \offset )^{2} \}$, and the variance is the smallest value this risk attains, i.e., its minimum at $\offset = \expect\{\truelabel\}$ (Bertsekas and Tsitsiklis, 2008): \[ \expect\big\{ \big( \truelabel - \expect\{\truelabel\} \big)^{2} \big\} = \min_{\offset \in \reals} \expect\big\{ ( \truelabel - \offset )^{2} \big\} \text{.} \]
P-ermThis minimum-risk characterization applies directly to the
simplest machine learning (ML) problem, predicting a numeric label
$\truelabel$ without using any features. The hypothesis space for
this problem consists of the constant maps $\hypothesis(\cdot) = \offset$
with $\offset \in \reals$. Each such hypothesis amounts to a single
bias term: it delivers the same prediction $\offset$ for every
data point. Given a training set
$\trainset = \big\{ \truelabel^{(1)}, \,\ldots, \,\truelabel^{(\samplesize)} \big\}$
that consists of labels $\truelabel^{(\sampleidx)} \in \reals$
only, empirical risk minimization (ERM) with the squared error loss amounts to finding the
constant that best predicts the label of a data point:
the solution $\widehat{\offset}$ is the sample mean
of the labels (see mean), and the training error of
the learned hypothesis is the sample variance of the
labels (the script pythondemos/variance.py
verifies both identities numerically). For the
temperatures of Fig. 1, the learned
hypothesis is the dashed line:
$\widehat{\offset} = 20.5\,^{\circ}$C, with training error
$6.34/7 \approx 0.91$. At the level of
the underlying probability distribution, the
variance of the label is the smallest risk that a
constant prediction can achieve under the squared error loss. It
therefore serves as a baseline: an ML method that uses
features is useful only if its risk falls below the
variance of the label.
P-vectorThe definition extends to random vectors $\featurevec$ as the expectation of the squared Euclidean norm of the deviation from the mean, $\expect\big\{ \normgeneric{\featurevec - \expect\{\featurevec \}}{2}^{2} \big\} = \tr{\covmtx{\featurevec}}$, i.e., the sum of the variances of the entries of $\featurevec$, written compactly as the trace of the covariance matrix $\covmtx{\featurevec}$.
Synonyms: second central moment.
See also: random variable, random vector, expectation, mean, sample variance, standard deviation, probability distribution, empirical risk minimization, squared error loss, baseline, covariance matrix, trace, outlier.
@misc{dictml_variance,
  author = {Jung, Alexander},
  editor = {Olioumtsevits, Konstantina and Schnoor, Ekkehard},
  title = {variance},
  howpublished = {Dictionary of Applied Machine Learning (course edition)},
  year = {2026},
  doi = {10.5281/zenodo.21569296},
  note = {ISBN 978-952-64-3013-3, CC BY 4.0, retrieved 2026-09-21},
  url = {https://dictionaryofml.org/terms/variance.html}
}