P-robust writes when the script runsDictionary of Applied Machine Learning · mean
Numerical companion to the entry mean: it recomputes what the entry states and prints one line per check
One block per paragraph of the entry (marked [P...]): each block verifies numerically what the corresponding statement asserts. Self-contained (numpy/matplotlib only), fixed seed.
Run it without installing anything:uv run https://dictionaryofml.org/terms/mean.py
uv downloads this script and the pinned NumPy and Matplotlib it needs, then runs it; the script fetches any input file it uses. To keep the output files, download mean.py into a folder and run uv run mean.py there. With NumPy and Matplotlib already installed, python3 mean.py, from any directory — it writes its output files into the current directory. Fixed seeds, so the printed numbers reproduce exactly. Download mean.py · Notebook · Open in Colab
One cell per block of the script: the code, and what that code printed when it last ran here
"""
mean.py — numerical companion to the glossary entry 'mean'.

One block per paragraph of the entry (marked [P...]): each block verifies
numerically what the corresponding statement asserts. Self-contained
(numpy/matplotlib only), fixed seed.

Blocks
------
[P-def]     The mean of a random vector is its expectation, the Lebesgue
            integral of x with respect to its probability distribution:
            the Monte Carlo average of iid draws converges to the exact
            (analytic) mean as the sample grows.
[P-sample]  A dataset D defines a discrete RV x~ = x^(I) with I uniform on
            {1,...,m}; the mean of x~ equals the sample mean
            (1/m) sum_r x^(r) exactly.
[P-argmin]  For an RV with finite second moment, E{x} minimizes the risk
            E{||x - c||^2}: the analytic mean beats every candidate c on a
            grid, and the average loss over the sample has its minimum at
            the sample mean.
[P-erm]     Featureless regression: ERM with squared error loss over
            labels y^(1..m) is solved by the sample mean — the closed-form
            minimizer of (1/m) sum_r (y^(r) - h)^2 equals np.mean(y), and
            every other h has larger average loss (setting of Fig. 1,
            m = 5 labels with mean 4).
[P-robust]  Outliers and the mean: moving one of m data points by delta
            shifts the sample mean by exactly delta/m, without bound. With
            at most gamma*m points corrupted, the gamma-trimmed mean and the
            median stay bounded however far those points are moved.

Outputs
-------
mean.png : preview figure (checking only).

Data generated by pythondemos/mean.py.
"""

import numpy as np
import matplotlib

matplotlib.use("Agg")
import matplotlib.pyplot as plt
from pathlib import Path

OUT_DIR = Path(__file__).parent

rng = np.random.default_rng(42)
report = []


def check(name, ok):
    report.append((name, bool(ok)))
    print(f"  [{'ok' if ok else 'FAIL'}] {name}")
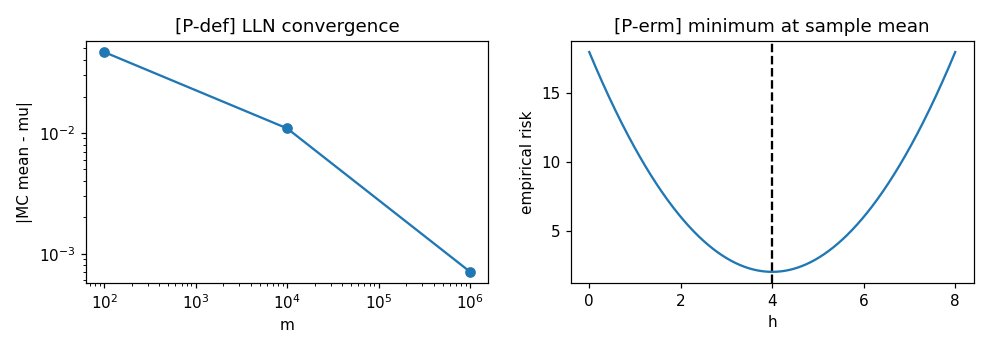
The mean of a random vector is its expectation, the Lebesgue integral of x with respect to its probability distribution: the Monte Carlo average of iid draws converges to the exact (analytic) mean as the sample grows.
# Mean = expectation = integral of x dP(x). Monte Carlo average of iid
# draws from N(mu, C) converges to the analytic mean mu.
print("[P-def] Monte Carlo average converges to the analytic mean")
mu = np.array([1.0, -2.0])
A = np.array([[1.0, 0.0], [0.5, 0.8]])
errs = []
for m in [10**2, 10**4, 10**6]:
    x = rng.standard_normal((m, 2)) @ A.T + mu
    errs.append(np.linalg.norm(x.mean(axis=0) - mu))
print(f"    |MC mean - mu| for m=1e2,1e4,1e6: "
      f"{errs[0]:.4f}, {errs[1]:.4f}, {errs[2]:.4f}")
check("MC error shrinks monotonically", errs[0] > errs[1] > errs[2])
check("MC mean at m=1e6 within 3e-3 of mu", errs[2] < 3e-3)
[P-def] Monte Carlo average converges to the analytic mean
    |MC mean - mu| for m=1e2,1e4,1e6: 0.0467, 0.0109, 0.0007
  [ok] MC error shrinks monotonically
  [ok] MC mean at m=1e6 within 3e-3 of mu
A dataset D defines a discrete RV x~ = x^(I) with I uniform on {1,...,m}; the mean of x~ equals the sample mean (1/m) sum_r x^(r) exactly.
# Discrete RV x~ = x^(I), I uniform on {1,...,m}: its mean is exactly the
# sample mean of the dataset.
print("[P-sample] dataset-induced discrete RV has mean = sample mean")
D = rng.normal(size=(7, 2))
probs = np.full(7, 1 / 7)                      # P(I = r) = 1/m
mean_discrete = (probs[:, None] * D).sum(axis=0)
check("E{x^(I)} equals (1/m) sum_r x^(r)",
      np.allclose(mean_discrete, D.mean(axis=0)))
[P-sample] dataset-induced discrete RV has mean = sample mean
  [ok] E{x^(I)} equals (1/m) sum_r x^(r)
For an RV with finite second moment, E{x} minimizes the risk E{||x - c||^2}: the analytic mean beats every candidate c on a grid, and the average loss over the sample has its minimum at the sample mean.
# E{x} = argmin_c E{||x - c||^2}. Empirically: risk(c) >= risk(mean) for
# every c on a grid, with equality only at c = mean.
print("[P-argmin] the mean minimizes the expected squared distance")
x = rng.standard_normal((200000, 2)) @ A.T + mu
def emp_risk(c):
    return np.mean(np.sum((x - c) ** 2, axis=1))
risk_mean = emp_risk(x.mean(axis=0))
grid = [x.mean(axis=0) + d for d in
        (np.array([0.5, 0]), np.array([-0.3, 0.4]), np.array([0, -1.0]))]
check("risk(mean) < risk(c) for all offset candidates c",
      all(emp_risk(c) > risk_mean for c in grid))
[P-argmin] the mean minimizes the expected squared distance
  [ok] risk(mean) < risk(c) for all offset candidates c
Featureless regression: ERM with squared error loss over labels y^(1..m) is solved by the sample mean — the closed-form minimizer of (1/m) sum_r (y^(r) - h)^2 equals np.mean(y), and every other h has larger average loss (setting of Fig. 1, m = 5 labels with mean 4).
# Featureless regression (Fig. 1 setting): labels 2,5,3,6,4; ERM with the
# squared error loss is solved by the sample mean h_hat = 4.
print("[P-erm] featureless ERM with squared loss = sample mean")
y = np.array([2.0, 5.0, 3.0, 6.0, 4.0])
h_grid = np.linspace(0, 8, 1601)
emp = np.array([np.mean((y - h) ** 2) for h in h_grid])
h_hat = h_grid[np.argmin(emp)]
check("grid minimizer equals np.mean(y) = 4", abs(h_hat - y.mean()) < 5e-3)
check("sample mean is 4 (entry Fig. 1)", np.isclose(y.mean(), 4.0))
check("every other h has larger average loss",
      np.all(emp >= np.mean((y - y.mean()) ** 2) - 1e-12))
[P-erm] featureless ERM with squared loss = sample mean
  [ok] grid minimizer equals np.mean(y) = 4
  [ok] sample mean is 4 (entry Fig. 1)
  [ok] every other h has larger average loss
Outliers and the mean: moving one of m data points by delta shifts the sample mean by exactly delta/m, without bound. With at most gamma*m points corrupted, the gamma-trimmed mean and the median stay bounded however far those points are moved.
# The entry's claim: moving one data point by delta shifts the sample mean
# by delta/m, so a single corrupted point carries it arbitrarily far, while
# the trimmed mean and the median do not move.
print("[P-robust] outliers move the mean without bound, the robust summaries stay bounded")

base = rng.normal(size=101)
m_pts = base.size
for delta in (10.0, 1e3, 1e6):
    moved = base.copy()
    moved[0] += delta
    check(f"one point moved by {delta:g}: mean shifts by delta/m",
          np.isclose(moved.mean() - base.mean(), delta / m_pts))

def trimmed(a, gamma):
    """Discard the floor(gamma*len) smallest and largest, average the rest."""
    k = int(np.floor(gamma * a.size))
    return np.sort(a)[k: a.size - k].mean() if a.size - 2 * k > 0 else np.nan

GAMMA = 0.1
n_bad = int(np.floor(GAMMA * m_pts))          # at most gamma*m corrupted

def summaries(delta):
    bad = base.copy()
    bad[:n_bad] += delta
    return bad.mean(), trimmed(bad, GAMMA), np.median(bad)

# The robust summaries are NOT unchanged -- corrupting points changes which
# order statistics are averaged -- but they stay BOUNDED as the corruption
# grows without bound, which is the property that matters.
rows = [summaries(d) for d in (1e3, 1e6, 1e9)]
mean_shift = [abs(r[0] - base.mean()) for r in rows]
trim_shift = [abs(r[1] - trimmed(base, GAMMA)) for r in rows]
med_shift = [abs(r[2] - np.median(base)) for r in rows]
print(f"    delta=1e3,1e6,1e9 -> mean moves by "
      f"{mean_shift[0]:.3g}, {mean_shift[1]:.3g}, {mean_shift[2]:.3g}")
print(f"                        trimmed moves by "
      f"{trim_shift[0]:.3g}, {trim_shift[1]:.3g}, {trim_shift[2]:.3g}")
check(f"mean diverges with delta ({n_bad} of {m_pts} corrupted)",
      mean_shift[2] > 1e6)
check("trimmed mean stays bounded as delta grows",
      max(trim_shift) < 1.0 and trim_shift[2] == trim_shift[0])
check("median stays bounded as delta grows",
      max(med_shift) < 1.0 and med_shift[2] == med_shift[0])

# ------------------------------------------------------------ preview
fig, ax = plt.subplots(1, 2, figsize=(9, 3.2))
ax[0].loglog([1e2, 1e4, 1e6], errs, "o-")
ax[0].set_xlabel("m"); ax[0].set_ylabel("|MC mean - mu|")
ax[0].set_title("[P-def] average approaches the mean")
ax[1].plot(h_grid, emp)
ax[1].axvline(y.mean(), ls="--", c="k")
ax[1].set_xlabel("h"); ax[1].set_ylabel("average loss")
ax[1].set_title("[P-erm] minimum at sample mean")
fig.tight_layout()
fig.savefig(OUT_DIR / "mean.png", dpi=110)
print(f"\n{sum(ok for _, ok in report)}/{len(report)} checks passed")
assert all(ok for _, ok in report)
[P-robust] outliers move the mean without bound, the robust summaries stay bounded
  [ok] one point moved by 10: mean shifts by delta/m
  [ok] one point moved by 1000: mean shifts by delta/m
  [ok] one point moved by 1e+06: mean shifts by delta/m
    delta=1e3,1e6,1e9 -> mean moves by 99, 9.9e+04, 9.9e+07
                        trimmed moves by 0.257, 0.257, 0.257
  [ok] mean diverges with delta (10 of 101 corrupted)
  [ok] trimmed mean stays bounded as delta grows
  [ok] median stays bounded as delta grows

13/13 checks passed
P-robust writes when the script runs