P-featnoise writes when the script runsDictionary of Applied Machine Learning · data point
Numerical companion to the entry data point: it recomputes what the entry states and prints one line per check
One block per paragraph of the entry (marked [P...]): each block verifies numerically what the corresponding statement asserts. Self-contained (numpy/matplotlib only), fixed seed.
Run it without installing anything:uv run https://dictionaryofml.org/terms/datapoint.py
uv downloads this script and the pinned NumPy and Matplotlib it needs, then runs it; the script fetches any input file it uses. To keep the output files, download datapoint.py into a folder and run uv run datapoint.py there. With NumPy and Matplotlib already installed, python3 datapoint.py, from any directory — it writes its output files into the current directory. Fixed seeds, so the printed numbers reproduce exactly. Download datapoint.py · Notebook · Open in Colab
One cell per block of the script: the code, and what that code printed when it last ran here
"""
datapoint.py — numerical companion to the glossary entry 'data point'.

One block per paragraph of the entry (marked [P...]): each block verifies
numerically what the corresponding statement asserts. Self-contained
(numpy/matplotlib only), fixed seed.

Blocks
------
[P-featlab]  A data point carries two categories of properties: features
             (measurable/computable) and labels (higher-level facts). A
             synthetic image data point yields pixel-intensity features
             by computation, while its label (number of bright objects)
             is fixed by construction — known to the "expert" that
             generated the scene, not read off a sensor.
[P-image]    The image example: color intensities of all pixels serve as
             features x_1..x_d, and can be augmented with capture
             metadata (timestamp, location) as further features.
[P-choice]   Feature vs label is a design choice: the same attribute
             (body weight) acts as a feature when predicting disease and
             as the label when predicted from other attributes — both
             predictions run on the same patient table.
[P-labelnoise] Labels are error-prone proxies: one-sided label noise
             (a fraction of positive training labels recorded as
             negative, as when a diagnosis is missed) monotonically
             depresses the fraction of positive test data points that
             the learned hypothesis predicts correctly on clean test
             data.
[P-featnoise] Features are error-prone too: adding measurement noise to
             the features at prediction time increases the error of a
             fixed learned hypothesis monotonically in the sensor noise.

Outputs
-------
datapoint.png : preview figure (checking only).

Data generated by pythondemos/datapoint.py.
"""

import numpy as np
import matplotlib

matplotlib.use("Agg")
import matplotlib.pyplot as plt
from pathlib import Path

OUT_DIR = Path(__file__).parent

rng = np.random.default_rng(42)
report = []


def check(name, ok):
    report.append((name, bool(ok)))
    print(f"  [{'ok' if ok else 'FAIL'}] {name}")
A data point carries two categories of properties: features (measurable/computable) and labels (higher-level facts). A synthetic image data point yields pixel-intensity features by computation, while its label (number of bright objects) is fixed by construction — known to the "expert" that generated the scene, not read off a sensor.
print("[P-featlab] features are computed; labels are known facts")
def make_scene(n_objects):
    img = 0.05 * rng.random((16, 16))
    for _ in range(n_objects):
        i, j = rng.integers(2, 14, size=2)
        img[i - 1:i + 2, j - 1:j + 2] = 1.0
    return img

label_true = 3                                   # higher-level fact
img = make_scene(label_true)
features = np.array([img.mean(), img.std(), img.max()])
check("features are computed from the data point itself",
      np.isclose(features[0], img.mean()))
check("the label is not a pixel statistic (needs scene knowledge)",
      label_true not in np.round(features).astype(int)[:1])
[P-featlab] features are computed; labels are known facts
  [ok] features are computed from the data point itself
  [ok] the label is not a pixel statistic (needs scene knowledge)
The image example: color intensities of all pixels serve as features x_1..x_d, and can be augmented with capture metadata (timestamp, location) as further features.
print("[P-image] pixel intensities + metadata as features")
x_pixels = img.flatten()
x_meta = np.array([1717.0, 47.5])                # timestamp, latitude
x = np.concatenate([x_pixels, x_meta])
check("pixel features have length d = 256", x_pixels.size == 16 * 16)
check("metadata extends the features to d + 2", x.size == 258)
[P-image] pixel intensities + metadata as features
  [ok] pixel features have length d = 256
  [ok] metadata extends the features to d + 2
Feature vs label is a design choice: the same attribute (body weight) acts as a feature when predicting disease and as the label when predicted from other attributes — both predictions run on the same patient table.
print("[P-choice] feature vs label is a design choice")
m = 300
weight = 60 + 20 * rng.random(m)
age = 20 + 50 * rng.random(m)
disease = (0.03 * weight + 0.05 * age + rng.normal(0, 0.4, m) > 4.5)
# design A: weight is a FEATURE for predicting the disease label
XA = np.stack([weight, age], axis=1)
wA = np.linalg.lstsq(np.c_[XA, np.ones(m)], disease.astype(float),
                     rcond=None)[0]
accA = np.mean((np.c_[XA, np.ones(m)] @ wA > 0.5) == disease)
# design B: weight is the LABEL predicted from age and disease status
XB = np.c_[age, disease.astype(float), np.ones(m)]
wB = np.linalg.lstsq(XB, weight, rcond=None)[0]
check("design A: weight used as a feature (prediction beats chance)",
      accA > 0.6)
check("design B: weight used as the label (predicted better than by its average)",
      np.var(weight - XB @ wB) < np.var(weight))
[P-choice] feature vs label is a design choice
  [ok] design A: weight used as a feature (prediction beats chance)
  [ok] design B: weight used as the label (predicted better than by its average)
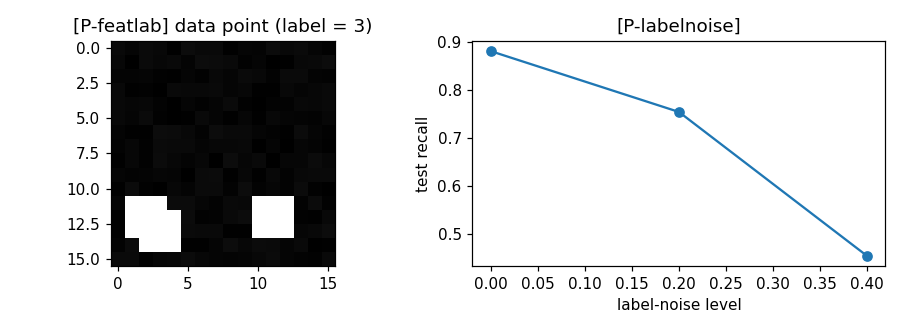
Labels are error-prone proxies: one-sided label noise (a fraction of positive training labels recorded as negative, as when a diagnosis is missed) monotonically depresses the fraction of positive test data points that the learned hypothesis predicts correctly on clean test data.
print("[P-labelnoise] label noise degrades the learned hypothesis")
def train_test_acc(flip, reps=25):
    accs_r = []
    for _ in range(reps):
        Xtr, Xte = XA[:200], XA[200:]
        ytr, yte = disease[:200].copy(), disease[200:]
        pos = np.nonzero(ytr)[0]                  # missed diagnoses:
        idx = rng.choice(pos, int(flip * pos.size), replace=False)
        ytr[idx] = False                          # positives recorded negative
        wn = np.linalg.lstsq(np.c_[Xtr, np.ones(200)],
                             ytr.astype(float), rcond=None)[0]
        pred = np.c_[Xte, np.ones(100)] @ wn > 0.5
        accs_r.append(np.mean(pred[yte]))         # correct predictions on positive data points
    return float(np.mean(accs_r))

accs = [train_test_acc(f) for f in (0.0, 0.2, 0.4)]
print(f"    correctly predicted positives at flip = 0, 0.2, 0.4: "
      f"{accs[0]:.2f}, {accs[1]:.2f}, {accs[2]:.2f}")
check("correct positive predictions decrease with the label-noise level",
      accs[0] > accs[1] > accs[2])
[P-labelnoise] label noise degrades the learned hypothesis
    correctly predicted positives at flip = 0, 0.2, 0.4: 0.88, 0.75, 0.45
  [ok] correct positive predictions decrease with the label-noise level
Features are error-prone too: adding measurement noise to the features at prediction time increases the error of a fixed learned hypothesis monotonically in the sensor noise.
print("[P-featnoise] feature measurement noise degrades predictions")
w_clean = np.linalg.lstsq(np.c_[XA, np.ones(m)], disease.astype(float),
                          rcond=None)[0]
errs = []
for s in (0.0, 5.0, 15.0):
    Xn = XA + rng.normal(0, s, XA.shape)          # sensor uncertainty
    errs.append(np.mean((np.c_[Xn, np.ones(m)] @ w_clean > 0.5)
                        != disease))
print(f"    error at sensor noise 0, 5, 15: "
      f"{errs[0]:.2f}, {errs[1]:.2f}, {errs[2]:.2f}")
check("prediction error grows with feature noise", errs[0] < errs[1] < errs[2])

# ------------------------------------------------------------ preview
fig, ax = plt.subplots(1, 2, figsize=(8.2, 3.0))
ax[0].imshow(img, cmap="gray")
ax[0].set_title(f"[P-featlab] data point (label = {label_true})")
ax[1].plot([0, 0.2, 0.4], accs, "o-")
ax[1].set_xlabel("label-noise level"); ax[1].set_ylabel("correct positive predictions")
ax[1].set_title("[P-labelnoise]")
fig.tight_layout()
fig.savefig(OUT_DIR / "datapoint.png", dpi=110)
print(f"\n{sum(ok for _, ok in report)}/{len(report)} checks passed")
assert all(ok for _, ok in report)
[P-featnoise] feature measurement noise degrades predictions
    error at sensor noise 0, 5, 15: 0.13, 0.15, 0.25
  [ok] prediction error grows with feature noise

8/8 checks passed
P-featnoise writes when the script runs