B-spread writes when the script runsDictionary of Applied Machine Learning · validation error
Numerical companion to the entry validation error: it recomputes what the entry states and prints one line per check
The entry's weather narrative, carried out: a straight line fitted to days of synthetic weather recordings (morning minimum and maximum daytime temperature), and its validation error computed, compared with the risk, and resampled over random splits. The entry's figure is drawn from the numbers computed here. Self-contained (numpy/matplotlib only), deterministic.
Run it with python3 valerr.py, from any directory — it writes its output files into the current directory. Requires NumPy and Matplotlib only, and uses fixed seeds, so the printed numbers reproduce exactly. Download valerr.py · Notebook · Open in Colab
One cell per block of the script: the code, and what that code printed when it last ran here
"""
valerr.py -- numerical companion to the entry 'validation error'.

The entry's weather narrative, carried out: a straight line fitted to days
of synthetic weather recordings (morning minimum and maximum daytime
temperature), and its validation error computed, compared with the risk, and
resampled over random splits. The entry's figure is drawn from the numbers
computed here. Self-contained (numpy/matplotlib only), deterministic.

Blocks
------
[B-def]    Fit a line to a training set of 40 days and compute its
           validation error: the average squared error over 20 held-back
           days, with the line fixed.
[B-risk]   The validation error estimates the risk (approximated by the
           average loss on 200000 fresh days); the training error
           understates it.
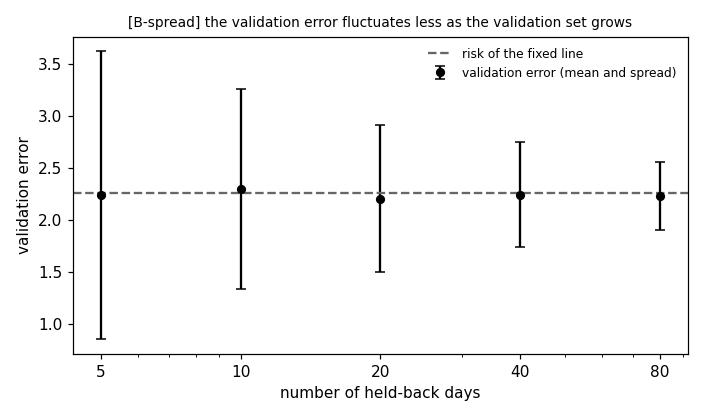
[B-spread] The validation error is an average of the per-day losses, so it
           is itself a random quantity: recomputed over 300 random splits
           per validation-set size, its spread shrinks as the validation set
           grows. Writes the CSV behind the entry's figure.

Outputs
-------
pythondemos/valerr_spread.csv : validation-set size, mean and spread of the
                                validation error over 300 random splits.
pythondemos/valerr_risk.csv   : the risk of the line fitted to a fixed
                                training set, for the figure's dashed level.
pythondemos/valerr.png        : preview figure (checking only).
"""

import numpy as np
import matplotlib

matplotlib.use("Agg")
import matplotlib.pyplot as plt

from pathlib import Path

OUT_DIR = Path(__file__).parent

report = []


def check(name, ok):
    report.append((name, bool(ok)))
    print(f"  [{'ok' if ok else 'FAIL'}] {name}")


def days(n, seed, noise=1.5):
    """n days: morning minimum x and maximum daytime temperature y."""
    gen = np.random.default_rng(seed)
    x = gen.uniform(-15.0, 5.0, n)
    y = 4.0 + 0.8 * x + gen.normal(0.0, noise, n)
    return x, y


def avg_sqerr(x, y, coef):
    return float(np.mean((y - np.polyval(coef, x)) ** 2))
Fit a line to a training set of 40 days and compute its validation error: the average squared error over 20 held-back days, with the line fixed.
print("[B-def] the validation error of a fitted line")

x, y = days(60, seed=20260828)
tr, va = np.arange(40), np.arange(40, 60)
line = np.polyfit(x[tr], y[tr], 1)
losses = (y[va] - np.polyval(line, x[va])) ** 2
valerr = avg_sqerr(x[va], y[va], line)
trainerr = avg_sqerr(x[tr], y[tr], line)
print(f"    validation error {valerr:.3f} = average of {len(va)} per-day "
      f"squared errors; training error {trainerr:.3f}")
check("the validation error is the average of the per-day losses",
      np.isclose(valerr, float(np.mean(losses)), atol=1e-12))
check("the line is fixed: computing it changed no coefficient",
      np.allclose(line, np.polyfit(x[tr], y[tr], 1)))
[B-def] the validation error of a fitted line
    validation error 2.873 = average of 20 per-day squared errors; training error 2.452
  [ok] the validation error is the average of the per-day losses
  [ok] the line is fixed: computing it changed no coefficient
The validation error estimates the risk (approximated by the average loss on 200000 fresh days); the training error understates it.
print("\n[B-risk] the validation error estimates the risk; the training "
      "error understates it")

xf, yf = days(200_000, seed=99)
risk = avg_sqerr(xf, yf, line)
print(f"    validation error {valerr:.3f}, risk (200000 fresh days) "
      f"{risk:.3f}, training error {trainerr:.3f}")
check("the validation error is within 25% of the risk",
      abs(valerr - risk) < 0.25 * risk)
check("the training error is below the risk", trainerr < risk)
[B-risk] the validation error estimates the risk; the training error understates it
    validation error 2.873, risk (200000 fresh days) 2.614, training error 2.452
  [ok] the validation error is within 25% of the risk
  [ok] the training error is below the risk
The validation error is an average of the per-day losses, so it is itself a random quantity: recomputed over 300 random splits per validation-set size, its spread shrinks as the validation set grows. Writes the CSV behind the entry's figure.
print("\n[B-spread] an average over more held-back days fluctuates less")

SIZES = [5, 10, 20, 40, 80]
R = 300
rows = []
xl, yl = days(160, seed=3)          # a larger pool: 80 train + up to 80 val
trl = np.arange(80)
linel = np.polyfit(xl[trl], yl[trl], 1)
riskl = avg_sqerr(xf, yf, linel)
for nv in SIZES:
    errs = []
    for r in range(R):
        xr, yr = days(nv, seed=50_000 + 100 * nv + r)
        errs.append(avg_sqerr(xr, yr, linel))
    rows.append((nv, float(np.mean(errs)), float(np.std(errs))))
    print(f"    {nv:>2} held-back days: mean {rows[-1][1]:.3f}, spread "
          f"{rows[-1][2]:.3f}")
check("the spread shrinks as the validation set grows",
      all(a[2] > b[2] for a, b in zip(rows, rows[1:])))
check("each mean stays within 10% of the risk",
      all(abs(m - riskl) < 0.10 * riskl for _, m, _ in rows))

with open(OUT_DIR / "valerr_spread.csv", "w") as fh:
    fh.write("size,mean,spread\n")
    for nv, m, s in rows:
        fh.write(f"{nv},{m:.4f},{s:.4f}\n")
with open(OUT_DIR / "valerr_risk.csv", "w") as fh:
    fh.write("size,risk\n")
    fh.write(f"{SIZES[0]},{riskl:.4f}\n")
    fh.write(f"{SIZES[-1]},{riskl:.4f}\n")
print("    wrote valerr_{spread,risk}.csv")


# --------------------------------------------------------------- preview
fig, ax = plt.subplots(figsize=(6.4, 3.8))
ax.errorbar([r[0] for r in rows], [r[1] for r in rows],
            yerr=[r[2] for r in rows], fmt="o", ms=5, color="black",
            capsize=3, label="validation error (mean and spread)")
ax.axhline(riskl, ls="--", color="0.4", label="risk of the fixed line")
ax.set_xscale("log")
ax.set_xticks(SIZES)
ax.set_xticklabels([str(s) for s in SIZES])
ax.set_xlabel("number of held-back days")
ax.set_ylabel("validation error")
ax.set_title("[B-spread] the validation error fluctuates less as the "
             "validation set grows", fontsize=9)
ax.legend(frameon=False, fontsize=8)

fig.tight_layout()
fig.savefig(OUT_DIR / "valerr.png", dpi=110)

n_ok = sum(ok for _, ok in report)
print(f"\n{n_ok}/{len(report)} checks pass")
print("wrote valerr.png")
if n_ok != len(report):
    raise SystemExit(1)
[B-spread] an average over more held-back days fluctuates less
     5 held-back days: mean 2.239, spread 1.384
    10 held-back days: mean 2.298, spread 0.963
    20 held-back days: mean 2.208, spread 0.705
    40 held-back days: mean 2.247, spread 0.505
    80 held-back days: mean 2.233, spread 0.324
  [ok] the spread shrinks as the validation set grows
  [ok] each mean stays within 10% of the risk
    wrote valerr_{spread,risk}.csv

6/6 checks pass
wrote valerr.png
B-spread writes when the script runs