B-k writes when the script runsDictionary of Applied Machine Learning · $k$-fold cross-validation ($k$-fold CV)
Numerical companion to the entry $k$-fold cross-validation ($k$-fold CV): it recomputes what the entry states and prints one line per check
Carries out the entry's fifteen-day weather example and backs its two claims about k-fold CV: a single split into training set and validation set yields a verdict that moves with the split, which the average over k folds avoids; and the choice of k trades bias against variance of the estimate. Self-contained (numpy and matplotlib only), fixed seed.
Run it without installing anything:uv run https://dictionaryofml.org/terms/kfoldcv.py
uv downloads this script and the pinned NumPy and Matplotlib it needs, then runs it; the script fetches any input file it uses. To keep the output files, download kfoldcv.py into a folder and run uv run kfoldcv.py there. With NumPy and Matplotlib already installed, python3 kfoldcv.py, from any directory — it writes its output files into the current directory. Fixed seeds, so the printed numbers reproduce exactly. Download kfoldcv.py · Notebook · Open in Colab
One cell per block of the script: the code, and what that code printed when it last ran here
"""
kfoldcv.py — numerical companion to the glossary entry 'k-fold
cross-validation (k-fold CV)'.

Purpose
-------
Carries out the entry's fifteen-day weather example and backs its two
claims about k-fold CV: a single split into training set and validation
set yields a verdict that moves with the split, which the average over
k folds avoids; and the choice of k trades bias against variance of the
estimate.  Self-contained (numpy and matplotlib only), fixed seed.

Setup
-----
Fifteen days with feature x = morning minimum temperature (degrees C)
and label y = maximum daytime temperature (degrees C), the fifteen
coordinates drawn in the entry's figure.  The method under study is
ERM on a linear model h(x) = w1 x + w2 with the squared error loss.
Fold b (b = 1, ..., 5) holds days b, b + 5 and b + 10 in the order of
increasing x, so each fold has three days.  For the choice of k, the
same kind of fifteen-day dataset is drawn 2000 times from y = 4 + 0.8 x
plus noise, with x uniform on [-15, 5].

Blocks
------
[B-split]  Two single splits (fold 1 and fold 4 held out): the slopes
           of the learned hypotheses are 0.76 and 0.60, the validation
           errors 0.77 and 1.05 — the verdict moves with the split.
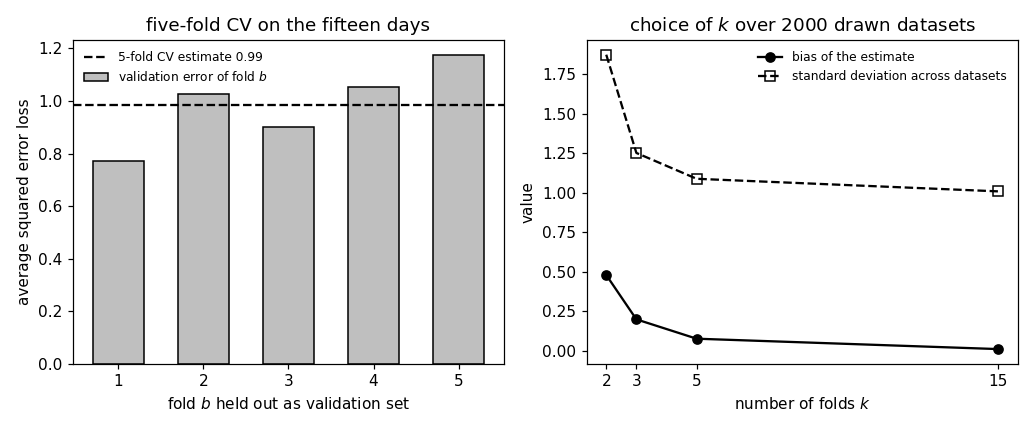
[B-cv]     Five-fold CV on the fifteen days: the five validation errors
           0.77, 1.03, 0.90, 1.05, 1.17 and their average 0.99, as the
           entry states them.
[B-k]      The choice of k on 2000 drawn datasets, for k = 2, 3, 5 and
           15 (leave-one-out): the estimate's bias with respect to the
           expected loss of ERM on all fifteen days falls with k, since
           each training set holds a fraction (k-1)/k of the days; the
           spread of the estimate across datasets is reported alongside.

Outputs
-------
kfoldcv_days.csv : the fifteen days with columns x, y, fold.
kfoldcv_folds.csv: fold index, slope and intercept of the learned
                   hypothesis, validation error of that fold.
kfoldcv_k.csv    : k, bias of the k-fold CV estimate and its standard
                   deviation across datasets.
kfoldcv.png      : matplotlib preview of the two figures (checking only).
"""

import numpy as np
import matplotlib

matplotlib.use("Agg")
import matplotlib.pyplot as plt

from pathlib import Path

OUT_DIR = Path(__file__).parent

report = []


def check(name, ok):
    report.append((name, bool(ok)))
    print(f"  [{'ok' if ok else 'FAIL'}] {name}")


x = np.array([0.4, 0.9, 1.3, 1.8, 2.2, 2.7, 3.2, 3.6, 4.1, 4.6, 5.0, 5.5,
              6.0, 6.5, 7.0])
y = np.array([7.99, 6.35, 8.24, 7.4, 9.58, 8.24, 9.9, 8.19, 10.15, 11.11,
              9.5, 11.36, 10.52, 12.58, 11.04])
m = len(x)
K = 5
fold = (np.arange(m) % K) + 1               # days b, b+5, b+10 form fold b


def erm_line(xs, ys):
    """ERM on the linear model with the squared error loss: slope, intercept."""
    A = np.c_[xs, np.ones_like(xs)]
    return np.linalg.lstsq(A, ys, rcond=None)[0]


def avg_sqerr(xs, ys, w):
    return float(np.mean((ys - (w[0] * xs + w[1])) ** 2))
Two single splits (fold 1 and fold 4 held out): the slopes of the learned hypotheses are 0.76 and 0.60, the validation errors 0.77 and 1.05 — the verdict moves with the split.
per_fold = []
for b in range(1, K + 1):
    tr, va = fold != b, fold == b
    w = erm_line(x[tr], y[tr])
    per_fold.append((b, w[0], w[1], avg_sqerr(x[va], y[va], w)))
s1, s4 = per_fold[0][1], per_fold[3][1]
v1, v4 = per_fold[0][3], per_fold[3][3]
check(f"[B-split] fold 1 held out: slope {s1:.2f}, validation error {v1:.2f};"
      f" fold 4 held out: slope {s4:.2f}, validation error {v4:.2f}",
      abs(s1 - 0.76) < 0.005 and abs(s4 - 0.60) < 0.005
      and abs(v1 - 0.77) < 0.005 and abs(v4 - 1.05) < 0.005)
[ok] [B-split] fold 1 held out: slope 0.76, validation error 0.77; fold 4 held out: slope 0.60, validation error 1.05
Five-fold CV on the fifteen days: the five validation errors 0.77, 1.03, 0.90, 1.05, 1.17 and their average 0.99, as the entry states them.
valerrs = np.array([p[3] for p in per_fold])
cv = float(valerrs.mean())
check(f"[B-cv]    five validation errors {np.round(valerrs, 2).tolist()}, "
      f"average {cv:.2f}",
      np.allclose(np.round(valerrs, 2), [0.77, 1.03, 0.90, 1.05, 1.17])
      and abs(cv - 0.99) < 0.005)
[ok] [B-cv] five validation errors [0.77, 1.03, 0.9, 1.05, 1.17], average 0.99
The choice of k on 2000 drawn datasets, for k = 2, 3, 5 and 15 (leave-one-out): the estimate's bias with respect to the expected loss of ERM on all fifteen days falls with k, since each training set holds a fraction (k-1)/k of the days; the spread of the estimate across datasets is reported alongside.
rng = np.random.default_rng(0)
R, N, NOISE = 2000, 15, 1.5
ks = [2, 3, 5, 15]


def draw(n):
    xs = rng.uniform(-15.0, 5.0, n)
    return xs, 4.0 + 0.8 * xs + rng.normal(0.0, NOISE, n)


x_fresh, y_fresh = draw(20000)              # for the expected loss
est = {k: [] for k in ks}
true_risk = []
for _ in range(R):
    xs, ys = draw(N)
    true_risk.append(avg_sqerr(x_fresh, y_fresh, erm_line(xs, ys)))
    for k in ks:
        f = np.arange(N) % k
        errs = []
        for b in range(k):
            w = erm_line(xs[f != b], ys[f != b])
            errs.append(avg_sqerr(xs[f == b], ys[f == b], w))
        est[k].append(float(np.mean(errs)))
risk = float(np.mean(true_risk))
rows = []
for k in ks:
    e = np.array(est[k])
    rows.append((k, float(e.mean() - risk), float(e.std())))
bias = {r[0]: r[1] for r in rows}
check(f"[B-k]     expected loss of ERM on 15 days {risk:.2f}; bias of the "
      f"k-fold CV estimate " + ", ".join(f"k={r[0]}: {r[1]:+.2f}" for r in rows),
      bias[2] > bias[5] > bias[15] and bias[2] > 0.1 and abs(bias[15]) < 0.1)

# ---------------------------------------------------------------- CSV
with open(OUT_DIR / "kfoldcv_days.csv", "w") as fh:
    fh.write("x,y,fold\n")
    for a, b, c in zip(x, y, fold):
        fh.write(f"{a:.2f},{b:.2f},{c}\n")
with open(OUT_DIR / "kfoldcv_folds.csv", "w") as fh:
    fh.write("fold,slope,intercept,valerr\n")
    for b, s, i, v in per_fold:
        fh.write(f"{b},{s:.4f},{i:.4f},{v:.4f}\n")
with open(OUT_DIR / "kfoldcv_k.csv", "w") as fh:
    fh.write("k,bias,std\n")
    for k, bi, sd in rows:
        fh.write(f"{k},{bi:.4f},{sd:.4f}\n")

# -------------------------------------------------------------- preview
fig, (ax1, ax2) = plt.subplots(1, 2, figsize=(9.4, 3.9))
bs = [p[0] for p in per_fold]
ax1.bar(bs, valerrs, width=0.6, color="0.75", edgecolor="black",
        label="validation error of fold $b$")
ax1.axhline(cv, color="black", ls="--", label=f"5-fold CV estimate {cv:.2f}")
ax1.set_xlabel("fold $b$ held out as validation set")
ax1.set_ylabel("average squared error loss")
ax1.set_title("five-fold CV on the fifteen days")
ax1.legend(frameon=False, fontsize=8)
ax2.plot(ks, [r[1] for r in rows], "ko-", label="bias of the estimate")
ax2.plot(ks, [r[2] for r in rows], "ks--", mfc="none",
         label="standard deviation across datasets")
ax2.set_xlabel("number of folds $k$")
ax2.set_ylabel("value")
ax2.set_title("choice of $k$ over 2000 drawn datasets")
ax2.set_xticks(ks)
ax2.legend(frameon=False, fontsize=8)
fig.tight_layout()
fig.savefig(OUT_DIR / "kfoldcv.png", dpi=110)

n_ok = sum(ok for _, ok in report)
print(f"\n{n_ok}/{len(report)} checks pass")
print(f"wrote {OUT_DIR / 'kfoldcv_days.csv'}, {OUT_DIR / 'kfoldcv_folds.csv'}, "
      f"{OUT_DIR / 'kfoldcv_k.csv'}, {OUT_DIR / 'kfoldcv.png'}")
if n_ok != len(report):
    raise SystemExit(1)
  [ok] [B-k]     expected loss of ERM on 15 days 2.62; bias of the k-fold CV estimate k=2: +0.48, k=3: +0.20, k=5: +0.08, k=15: +0.01

3/3 checks pass
wrote /Users/junga1/dictionaryappliedml/pythondemos/kfoldcv_days.csv, /Users/junga1/dictionaryappliedml/pythondemos/kfoldcv_folds.csv, /Users/junga1/dictionaryappliedml/pythondemos/kfoldcv_k.csv, /Users/junga1/dictionaryappliedml/pythondemos/kfoldcv.png
B-k writes when the script runs