B-plot writes when the script runsDictionary of Applied Machine Learning · unsupervised learning
Numerical companion to the entry unsupervised learning: it recomputes what the entry states and prints one line per check
Numerical companion to the glossary entry 'unsupervisedlearning'. The GeoSphere Austria weather station Krems (station id 3805) records eight measurements per day: minimum, maximum and mean air temperature, precipitation, sunshine duration, relative humidity, air pressure and wind speed. This script downloads the records for 2024 from the GeoSphere data hub (dataset klima-v2-1d) and writes them to unsupervisedlearning_weather.csv. Each day is a data point with eight features and no label: nothing in the record says what should be predicted for a day. A value of -1 for precipitation marks a trace of rain too small to record and is set to 0.
Run it with python3 unsupervisedlearning.py, from any directory — it writes its output files into the current directory. Requires NumPy and Matplotlib only, and uses fixed seeds, so the printed numbers reproduce exactly. Download unsupervisedlearning.py · Notebook · Open in Colab
One cell per block of the script: the code, and what that code printed when it last ran here
"""Unsupervised learning on a year of days at Krems: the same days
without any label, grouped into clusters, compressed to two features,
and fitted with a density -- and no criterion that says which of these
is right.

Purpose
-------
Numerical companion to the glossary entry 'unsupervisedlearning'.  The
GeoSphere Austria weather station Krems (station id 3805) records eight
measurements per day: minimum, maximum and mean air temperature,
precipitation, sunshine duration, relative humidity, air pressure and
wind speed.  This script downloads the records for 2024 from the
GeoSphere data hub (dataset klima-v2-1d) and writes them to
unsupervisedlearning_weather.csv.  Each day is a data point with eight
features and no label: nothing in the record says what should be
predicted for a day.  A value of -1 for precipitation marks a trace of
rain too small to record and is set to 0.

The demo checks the entry's claims about the three tasks the entry
names and about their evaluation: (1) clustering the days by k-means
with k = 2 separates the cold from the warm half of the year, although
no month, season or other label ever entered the computation; (2)
principal component analysis compresses the eight features to two with
a reconstruction error equal to the sum of the dropped eigenvalues of
the sample covariance matrix; (3) a Gaussian density fitted to the days
assigns a higher average log-density to held-out days than a density
that ignores the correlation between the measurements; and (4) none of
these has a direct measure of success: the smallest clustering error
found keeps falling as clusters are added, so it cannot say how many
clusters the data have, while in supervised learning the validation
error does say when a hypothesis is worse.

Deterministic: the data are a fixed archive year, the initial centroids
of the two-cluster run are the coldest and the warmest day, the
restarts of the last block draw from a fixed seed, and PCA is an
eigenvalue decomposition.  Self-contained: numpy + matplotlib only (stdlib urllib
for the download).

Blocks
------
[B-data]     Download the 366 days with eight measurements each, scale
             every feature to zero sample mean and unit sample
             variance, and check that the data carry no label.
[B-cluster]  k-means with k = 2 on the eight scaled features: check the
             clustering error never increases, that the iteration
             reaches a fixed point, and that the two clusters agree
             with the cold and warm half of the year on 90 percent of the days -- a comparison
             made only after the clustering, never during it.
[B-dimred]   Principal component analysis to two features: check the
             reconstruction error equals the sum of the dropped
             eigenvalues and that the two components carry more than
             half of the total variance.
[B-density]  A Gaussian fitted to the two temperature features: check
             its average log-density on held-out days exceeds that of a
             Gaussian with the same means but no correlation.
[B-nocriterion] No direct measure of success: the smallest clustering
             error found decreases with every added cluster (ten restarts
             per number of clusters, the best kept), so it cannot choose
             the number of clusters, whereas the validation error of
             supervised learning does grow when a hypothesis is worse.
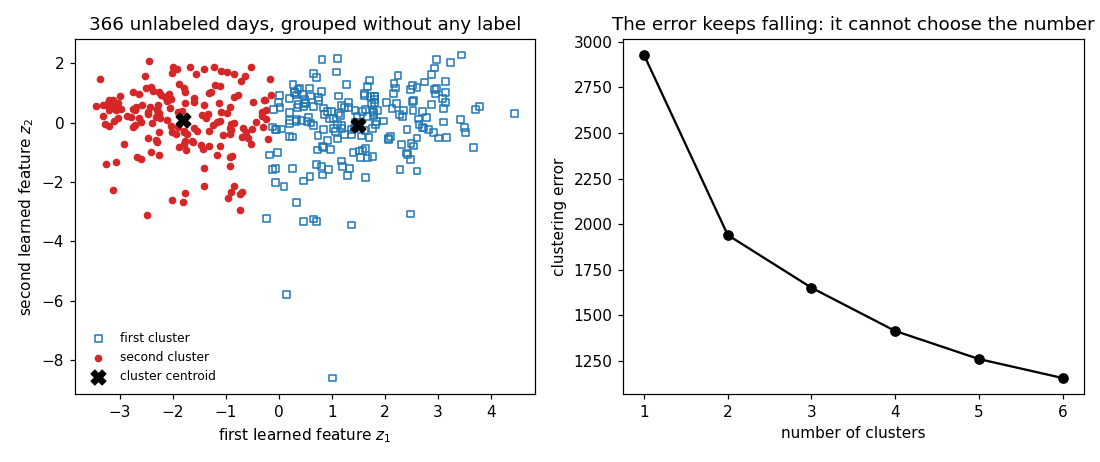
[B-plot]     Preview: the days in the two learned features marked by
             cluster, and the clustering error against the number of
             clusters.

Outputs
-------
unsupervisedlearning_weather.csv : date and the eight measurements
unsupervisedlearning_cluster1.csv, _cluster2.csv : z1, z2 per cluster
unsupervisedlearning_centroids.csv : z1, z2 of the two centroids
unsupervisedlearning_error.csv   : nrcluster, error
unsupervisedlearning.png         : preview (checking only)
"""

import json
import urllib.request
from pathlib import Path

import numpy as np
import matplotlib

matplotlib.use("Agg")
import matplotlib.pyplot as plt

OUT_DIR = Path(__file__).parent

report = []


def check(name, ok):
    report.append((name, bool(ok)))
    print(f"  [{'ok' if ok else 'FAIL'}] {name}")
Download the 366 days with eight measurements each, scale every feature to zero sample mean and unit sample variance, and check that the data carry no label.
PARAMS = ["tlmin", "tlmax", "tl_mittel", "rr", "so_h", "rf_mittel",
          "p_mittel", "vv_mittel"]
URL = ("https://dataset.api.hub.geosphere.at/v1/station/historical/"
       f"klima-v2-1d?parameters={','.join(PARAMS)}&station_ids=3805"
       "&start=2024-01-01&end=2024-12-31")
with urllib.request.urlopen(URL, timeout=120) as resp:
    payload = json.load(resp)
params = payload["features"][0]["properties"]["parameters"]
stamps = [t[:10] for t in payload["timestamps"]]
M = np.stack([np.array(params[p]["data"], dtype=float) for p in PARAMS], 1)
M[:, 3] = np.maximum(M[:, 3], 0.0)             # -1 marks a trace of rain
with open(OUT_DIR / "unsupervisedlearning_weather.csv", "w") as f:
    f.write("date," + ",".join(PARAMS) + "\n")
    for day, row in zip(stamps, M):
        f.write(day + "," + ",".join(f"{v:g}" for v in row) + "\n")
X = (M - M.mean(axis=0)) / M.std(axis=0)
m, d = X.shape
check("[B-data] 366 days with eight measurements each", (m, d) == (366, 8))
check("[B-data] the record matches the archive (Feb 1: -3.8 to 10.4 deg)",
      stamps[31] == "2024-02-01" and np.allclose(M[31, :2], [-3.8, 10.4]))
check("[B-data] the data carry features only, no label column",
      M.shape[1] == len(PARAMS))
  [ok] [B-data] 366 days with eight measurements each
  [ok] [B-data] the record matches the archive (Feb 1: -3.8 to 10.4 deg)
  [ok] [B-data] the data carry features only, no label column
k-means with k = 2 on the eight scaled features: check the clustering error never increases, that the iteration reaches a fixed point, and that the two clusters agree with the cold and warm half of the year on 90 percent of the days -- a comparison made only after the clustering, never during it.
def assign(X, centroids):
    dist = ((X[:, None, :] - centroids[None, :, :]) ** 2).sum(axis=2)
    return dist.argmin(axis=1)


def clustering_error(X, centroids, labels):
    return float(((X - centroids[labels]) ** 2).sum())


def lloyd(X, centroids):
    labels = assign(X, centroids)
    errors = [clustering_error(X, centroids, labels)]
    for _ in range(100):
        centroids = np.stack([X[labels == c].mean(axis=0)
                              if (labels == c).any() else centroids[c]
                              for c in range(len(centroids))])
        new = assign(X, centroids)
        errors.append(clustering_error(X, centroids, new))
        if np.array_equal(new, labels):
            break
        labels = new
    return centroids, labels, np.array(errors)


mean_temp = X[:, 2]
start = np.stack([X[mean_temp.argmin()], X[mean_temp.argmax()]])
centroids, labels, errors = lloyd(X, start)
check("[B-cluster] the clustering error never increases",
      bool(np.all(np.diff(errors) <= 1e-9)))
check("[B-cluster] the iteration reaches a fixed point",
      np.array_equal(assign(X, centroids), labels))
month = np.array([int(s[5:7]) for s in stamps])
cold_half = (month <= 3) | (month >= 11)       # used only for checking
warm_half = (month >= 5) & (month <= 9)
known = cold_half | warm_half
agree = max(np.mean(labels[known] == cold_half[known].astype(int)),
            np.mean(labels[known] == warm_half[known].astype(int)))
print(f"  k-means: {len(errors) - 1} iterations, clustering error "
      f"{errors[-1]:.0f}; the two clusters agree with the cold and warm "
      f"half of the year on {100 * agree:.1f}% of those days")
check("[B-cluster] the two clusters agree with the cold and warm half of "
      "the year on more than 85 percent of the days", agree > 0.85)
check("[B-cluster] no month or season entered the clustering",
      start.shape == (2, d))
  [ok] [B-cluster] the clustering error never increases
  [ok] [B-cluster] the iteration reaches a fixed point
  k-means: 10 iterations, clustering error 1940; the two clusters agree with the cold and warm half of the year on 90.2% of those days
  [ok] [B-cluster] the two clusters agree with the cold and warm half of the year on more than 85 percent of the days
  [ok] [B-cluster] no month or season entered the clustering
  PCA: eigenvalues 1-3 3.62, 1.47, 1.28 of total 8; reconstruction error 1066
Principal component analysis to two features: check the reconstruction error equals the sum of the dropped eigenvalues and that the two components carry more than half of the total variance.
Q = X.T @ X / m
eigvals, eigvecs = np.linalg.eigh(Q)
order = np.argsort(eigvals)[::-1]
eigvals, eigvecs = eigvals[order], eigvecs[:, order]
W = eigvecs[:, :2].T
Z = X @ W.T
recon = float(((X - Z @ W) ** 2).sum())
print(f"  PCA: eigenvalues 1-3 {eigvals[0]:.2f}, {eigvals[1]:.2f}, "
      f"{eigvals[2]:.2f} of total {eigvals.sum():.0f}; reconstruction "
      f"error {recon:.0f}")
check("[B-dimred] the reconstruction error equals m times the sum of the "
      "dropped eigenvalues", np.isclose(recon, m * eigvals[2:].sum()))
check("[B-dimred] the two components carry more than half of the total "
      "variance", eigvals[:2].sum() > 0.5 * eigvals.sum())
  [ok] [B-dimred] the reconstruction error equals m times the sum of the dropped eigenvalues
  [ok] [B-dimred] the two components carry more than half of the total variance
  density: average log-density on held-out days -6.452 with the fitted covariance against -7.194 without correlation
A Gaussian fitted to the two temperature features: check its average log-density on held-out days exceeds that of a Gaussian with the same means but no correlation.
temps = M[:, :2]
fit_days, held_days = temps[:244], temps[244:]
mu = fit_days.mean(axis=0)
C = np.cov(fit_days, rowvar=False)
C_diag = np.diag(np.diag(C))                   # same means, no correlation


def mean_log_density(U, mean, cov):
    diff = U - mean
    inv = np.linalg.inv(cov)
    quad = np.einsum("ij,jk,ik->i", diff, inv, diff)
    return float(np.mean(-0.5 * quad - 0.5 * np.log(np.linalg.det(cov))
                         - np.log(2.0 * np.pi)))


ll_full = mean_log_density(held_days, mu, C)
ll_diag = mean_log_density(held_days, mu, C_diag)
print(f"  density: average log-density on held-out days {ll_full:.3f} with "
      f"the fitted covariance against {ll_diag:.3f} without correlation")
check("[B-density] the fitted Gaussian beats the one that ignores the "
      "correlation between the measurements", ll_full > ll_diag)
  [ok] [B-density] the fitted Gaussian beats the one that ignores the correlation between the measurements
  clustering error by number of clusters: k=1: 2928, k=2: 1940, k=3: 1651, k=4: 1414, k=5: 1260, k=6: 1156
No direct measure of success: the smallest clustering error found decreases with every added cluster (ten restarts per number of clusters, the best kept), so it cannot choose the number of clusters, whereas the validation error of supervised learning does grow when a hypothesis is worse.
# The k-means iteration finds a local minimum, so the error of a single run
# need not fall when a cluster is added; ten restarts per number of
# clusters, the best kept, approximate the smallest error attainable.
rng = np.random.default_rng(0)
curve = []
for k in range(1, 7):
    best = np.inf
    for _ in range(10):
        init = X[rng.choice(m, size=k, replace=False)]
        _, _, err_k = lloyd(X, init)
        best = min(best, err_k[-1])
    curve.append((k, best))
errs = np.array([e for _, e in curve])
print("  clustering error by number of clusters: "
      + ", ".join(f"k={k}: {e:.0f}" for k, e in curve))
check("[B-nocriterion] the smallest clustering error found decreases with "
      "every added cluster, so it cannot choose their number",
      bool(np.all(np.diff(errs) < 0)))

# ---- CSVs for the entry's figure
np.savetxt(OUT_DIR / "unsupervisedlearning_cluster1.csv", Z[labels == 0],
           delimiter=",", header="z1,z2", comments="", fmt="%.3f")
np.savetxt(OUT_DIR / "unsupervisedlearning_cluster2.csv", Z[labels == 1],
           delimiter=",", header="z1,z2", comments="", fmt="%.3f")
np.savetxt(OUT_DIR / "unsupervisedlearning_centroids.csv",
           np.stack([centroids[c] @ W.T for c in (0, 1)]), delimiter=",",
           header="z1,z2", comments="", fmt="%.3f")
with open(OUT_DIR / "unsupervisedlearning_error.csv", "w") as f:
    f.write("nrcluster,error\n")
    for k, e in curve:
        f.write(f"{k},{e:.1f}\n")
  [ok] [B-nocriterion] the smallest clustering error found decreases with every added cluster, so it cannot choose their number

11/11 checks pass
Preview: the days in the two learned features marked by cluster, and the clustering error against the number of clusters.
fig, (ax1, ax2) = plt.subplots(1, 2, figsize=(10, 4.2))
ax1.scatter(Z[labels == 0, 0], Z[labels == 0, 1], marker="s",
            facecolors="none", edgecolors="tab:blue", s=20,
            label="first cluster")
ax1.scatter(Z[labels == 1, 0], Z[labels == 1, 1], marker="o", color="tab:red",
            s=16, label="second cluster")
cent = np.stack([centroids[c] @ W.T for c in (0, 1)])
ax1.scatter(cent[:, 0], cent[:, 1], marker="X", color="black", s=90,
            label="cluster centroid")
ax1.set_xlabel("first learned feature $z_1$")
ax1.set_ylabel("second learned feature $z_2$")
ax1.set_title("366 unlabeled days, grouped without any label")
ax1.legend(frameon=False, fontsize=8)
ax2.plot([k for k, _ in curve], errs, "ko-")
ax2.set_xlabel("number of clusters")
ax2.set_ylabel("clustering error")
ax2.set_title("The error keeps falling: it cannot choose the number")
fig.tight_layout()
fig.savefig(OUT_DIR / "unsupervisedlearning.png", dpi=110)

n_ok = sum(ok for _, ok in report)
print(f"\n{n_ok}/{len(report)} checks pass")
if n_ok != len(report):
    raise SystemExit(1)
B-plot writes when the script runs