outlier.py, which recomputes what the entry states: the script block by block · open in ColabDictionary of Applied Machine Learning: 147 machine-learning terms, each with a definition, a figure, citations and a Python demo · All terms · Demos · Start here
Updated on 2026-11-19
Readiness 90/100
See also robust principal component analysis squared error loss dimensionality reduction principal component analysis
An outlier is a data point that deviates so far from the rest of a dataset that it is suspected of having come about in a different way. Being an outlier is a judgment made against a stated probabilistic model or dataset and not a property a data point carries on its own: a day is typical for the year and extreme for its month, and two features can deviate jointly while neither deviates alone. Two sources have to be told apart, a probability distribution with a heavy tail and a mistaken or coded reading, because only the second calls for a repair of the data. With more than two features, dimensionality reduction to two learned features makes the deviating data points visible in a scatterplot, which is why it is a common first step. How much an outlier changes the learned hypothesis depends on the loss function: the squared error loss weighs a residual by its square and is far more sensitive to a mismeasured label than the absolute error loss. Least absolute deviation regression, Huber regression, and robust principal component analysis (robust PCA) are built on that difference, and a contamination model states how outliers enter the sample.
outlier.py, which recomputes what the entry states: the script block by block · open in ColabA weather station at Krems an der Donau (Austria) recorded $81.7$ millimeters of rain on 14 September $2024$, more than forty times the average daily amount of $1.9$ millimeters over that year. The same archive writes a day with no precipitation not as $0$ but as $-1$ millimeters, a code that $199$ of the $366$ days carry. The two numbers are the largest and the smallest value of their column, and only one of them marks a day worth a second look. An outlier is a data point that deviates so far from the rest of a dataset that it is suspected of having come about in a different way (Hawkins, 1980). What counts as far is set by a stated notion of ordinary behavior, so being an outlier is a judgment made against a probabilistic model or a dataset and never a property the data point carries on its own (Chandola et al., 2009, Sect. 1.1).
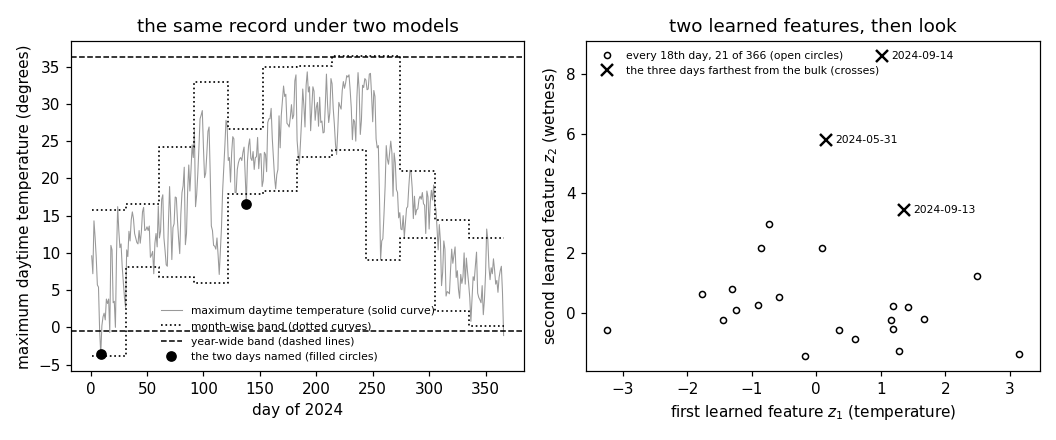
B-jointChanging the probabilistic model changes the answer while the
data stay as they are. Consider the screen that calls a day
unusual when its maximum daytime temperature lies more than two
standard deviations from the mean. Under a probabilistic model in which
that temperature is a Gaussian random variable (Gaussian RV) with mean $17.9$ and
standard deviation $9.2$ degrees, estimated from all $366$ days of
$2024$, the screen flags three days. With the mean and the standard deviation
estimated from the day's calendar month alone, it flags ten
days, and only 31 December under both. On 17 May the
maximum reached $16.6$ degrees, which lies $0.14$ standard deviations
below the mean of the year and $2.60$ below the mean
of May: typical for the year, extreme for its month. The coldest
maximum of $2024$, the $-3.6$ degrees of 9 January, runs the
other way, $2.34$ standard deviations below the mean of the year
and $1.94$ below the mean of January, an ordinary cold
winter day. Fig. 1 draws both screens
over the year.
pythondemos/outlier.py
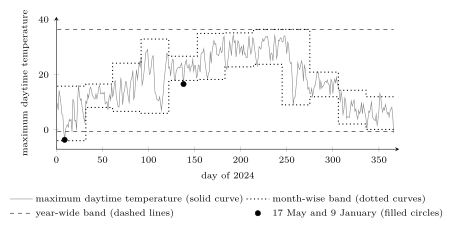
B-learnThe weather station records eight measurements on each day, and
eight numbers are more than a scatterplot can show.
Dimensionality reduction to two features is therefore a common first
step in finding outliers, because two numbers per
data point are what a scatterplot does show.
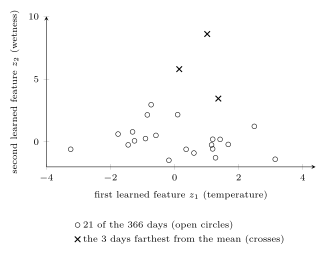
Principal component analysis (PCA) learns a linear map from the eight standardized
measurements of a day to $d' = 2$ features,
which keep $63.6$ percent of their variance; the first is a
temperature direction and the second a wetness direction. In
those two features, the deviating days are visible without
any screen at all, as Fig. 2 shows.
Evaluating the squared Mahalanobis distance
\(\eqref{equ_outlier_mahalanobis_dict}\) in those two
features rather than in the two temperatures puts 14
September at $50.7$, against $22.9$ for the second farthest day
and below $8.3$ for each of the remaining $363$ days.
pythondemos/outlier.py
B-lossRemoval is not the only response. How much an outlier changes the learned hypothesis depends on the loss function: the squared error loss weighs a residual by its square and the absolute error loss weighs it linearly, which makes least squares far more sensitive to a grossly mismeasured label than empirical risk minimization (ERM) with the absolute error loss (Hastie et al., 2009, Sect. 10.6). On the Krems record, least squares over the linear model learns a hypothesis that predicts the maximum daytime temperature of a day from its morning minimum. The maximum of 21 January $2024$ is $3.5$ degrees. A misplaced decimal point that records it as $35$ moves the predictions of that hypothesis by up to $0.56$ degrees and leaves the one learned with the absolute error loss where it was. Raising the same label to $1000$ moves the least squares predictions by $17.7$ degrees, and the other hypothesis still does not move at all. How far a single replaced data point can move the learned hypothesis is a question about the stability of the method. Least absolute deviation regression, Huber regression with the Huber loss, and robust principal component analysis (robust PCA) for a feature matrix are built on this difference, and a contamination model states how outliers enter the sample and what can then be guaranteed.
See also: anomaly detection, contamination model, robustness, stability, Huber regression, least absolute deviation regression, robust principal component analysis, absolute error loss, squared error loss, probabilistic model, dimensionality reduction, principal component analysis.
@misc{dictml_outlier,
  author = {Jung, Alexander},
  editor = {Olioumtsevits, Konstantina and Schnoor, Ekkehard},
  title = {outlier},
  howpublished = {Dictionary of Applied Machine Learning (course edition)},
  year = {2026},
  doi = {10.5281/zenodo.21569296},
  note = {ISBN 978-952-64-3013-3, CC BY 4.0, retrieved 2026-11-20},
  url = {https://dictionaryofml.org/terms/outlier.html}
}