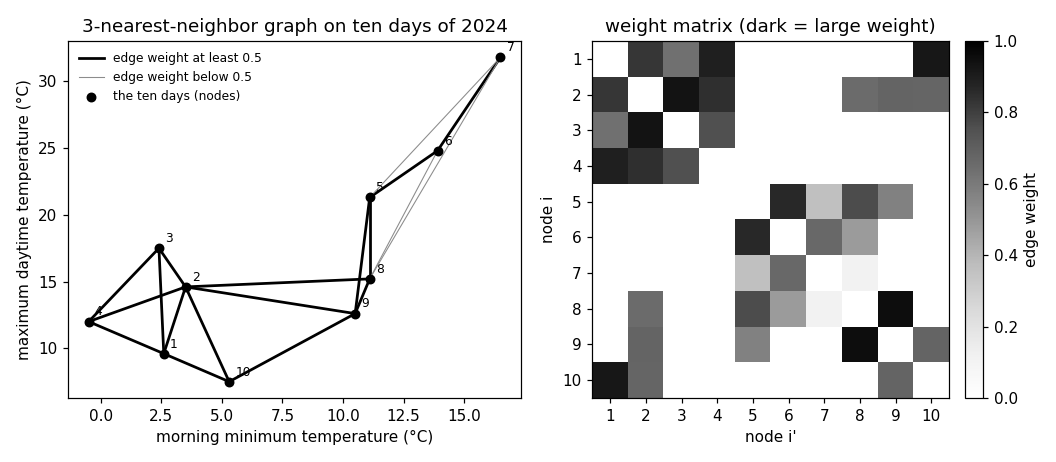
B-plot writes when the script runsDictionary of Applied Machine Learning · weighted graph
Updated on 2026-11-19
Numerical companion to the entry weighted graph: it recomputes what the entry states and prints one line per check
Numerical companion to the glossary entry 'weightedgraph'. Ten days of 2024 at Krems (every 37th day) are the nodes of a graph; the feature vector of a day holds its morning minimum and its maximum daytime temperature. Two days are joined by an edge when one is among the three nearest neighbors of the other in the feature plane, and the edge carries a Gaussian weight that falls off with the Euclidean distance between the two days. The demo builds this similarity graph, its weight matrix, and the weighted node degrees, and checks the properties the entry states: the weight matrix is symmetric with a zero diagonal and nonnegative entries, the edge set is the set of positive entries, a row sum is a weighted node degree, and the unweighted graph is the special case with entries 0 and 1. The same construction on all 366 days shows what graph clustering uses: the edges between the cold and the warm days carry a small share of the total weight.
Run it without installing anything:uv run https://dictionaryofml.org/terms/weightedgraph.py
uv downloads this script and the pinned NumPy and Matplotlib it needs, then runs it; the script fetches any input file it uses. To keep the output files, download weightedgraph.py into a folder and run uv run weightedgraph.py there. With NumPy and Matplotlib already installed, python3 weightedgraph.py, from any directory — it writes its output files into the current directory. Fixed seeds, so the printed numbers reproduce exactly. Download weightedgraph.py · Notebook · Open in Colab
Before running a downloaded copy, scan it: uvx bandit -q -t B102,B307,B602,B605 weightedgraph.py (B102,B307,B602,B605 are the exec, eval and shell checks of bandit) reports nothing: the script runs no shell command and evaluates no generated code.
One cell per block of the script: the code, and what that code printed when it last ran here
"""A weighted graph on days of one year at Krems an der Donau: nodes,
undirected edges, nonnegative edge weights and the weight matrix.

Purpose
-------
Numerical companion to the glossary entry 'weightedgraph'.  Ten days of
2024 at Krems (every 37th day) are the nodes of a graph; the feature
vector of a day holds its morning minimum and its maximum daytime
temperature.  Two days are joined by an edge when one is among the
three nearest neighbors of the other in the feature plane, and the
edge carries a Gaussian weight that falls off with the Euclidean
distance between the two days.  The demo builds this similarity graph,
its weight matrix, and the weighted node degrees, and checks the
properties the entry states: the weight matrix is symmetric with a zero
diagonal and nonnegative entries, the edge set is the set of positive
entries, a row sum is a weighted node degree, and the unweighted graph
is the special case with entries 0 and 1.  The same construction on
all 366 days shows what graph clustering uses: the edges between the
cold and the warm days carry a small share of the total weight.

Deterministic: no randomness anywhere.  Self-contained: numpy +
matplotlib only; the GeoSphere download falls back to the committed
CSV.

Blocks
------
[B-data]     Download the daily minimum and maximum temperature of 2024
             at Krems (GeoSphere station 3805) or read the committed
             copy; 366 days, no missing value.
[B-days]     Every 37th day of the year gives the ten nodes, numbered
             1 to 10 in order of date.
[B-weights]  Gaussian weights for all 45 pairs of days, with the width
             set to the mean distance of a day to its third nearest
             neighbor; the 3-nearest-neighbor graph keeps an edge when
             one day is among the three nearest of the other.  Weight
             matrix: symmetric, zero diagonal, nonnegative; edges =
             positive entries; row sums = weighted degrees; the
             unweighted graph has entries 0 and 1.
[B-cut]      The cold days (maximum temperature below 18 degrees) and
             the warm days: the edges between the two sets carry a
             smaller share of the weight than of the edges.
[B-year]     The 10-nearest-neighbor graph on all 366 days: number of
             edges, weighted degrees, and the share of the total weight
             that joins a cold day with a warm day; no edge joins a
             January or February day with a July or August day.
[B-plot]     CSVs for the figure (nodes, edges in two weight classes,
             the weight matrix) and the matplotlib preview.

Outputs
-------
weightedgraph_weather.csv      : date, tmin, tmax (committed copy).
weightedgraph_nodes.csv        : node, date, tmin, tmax of the ten days.
weightedgraph_pairs.csv        : every pair of nodes with its distance,
                                 its Gaussian weight and its weight in
                                 the 3-nearest-neighbor graph.
weightedgraph_edges_strong.csv : edges of weight at least 0.5 as
                                 nan-separated segments (x, y).
weightedgraph_edges_weak.csv   : edges of weight below 0.5, same form.
weightedgraph_matrix.csv       : i, ip, w; the 10 x 10 weight matrix of
                                 the 3-nearest-neighbor graph, row-wise.
weightedgraph.png              : matplotlib preview (checking only).
"""

# /// script
# requires-python = ">=3.10"
# dependencies = ["matplotlib==3.10.7", "numpy==2.3.4"]
# ///

import json
import urllib.request
from pathlib import Path

import numpy as np
import matplotlib

matplotlib.use("Agg")
import matplotlib.pyplot as plt

OUT_DIR = Path(__file__).parent

report = []


def check(name, ok):
    report.append((name, bool(ok)))
    print(f"  [{'ok' if ok else 'FAIL'}] {name}")
Download the daily minimum and maximum temperature of 2024 at Krems (GeoSphere station 3805) or read the committed copy; 366 days, no missing value.
print("[B-data] daily minimum and maximum temperature at Krems, 2024")
URL = ("https://dataset.api.hub.geosphere.at/v1/station/historical/"
       "klima-v2-1d?parameters=tlmin,tlmax&station_ids=3805"
       "&start=2024-01-01&end=2024-12-31")
CSV = OUT_DIR / "weightedgraph_weather.csv"
try:
    with urllib.request.urlopen(URL, timeout=120) as resp:
        payload = json.load(resp)
    params = payload["features"][0]["properties"]["parameters"]
    records = [(stamp[:10], lo, hi)
               for stamp, lo, hi in zip(payload["timestamps"],
                                        params["tlmin"]["data"],
                                        params["tlmax"]["data"])]
    with open(CSV, "w") as fh:
        fh.write("date,tmin,tmax\n")
        for day, lo, hi in records:
            fh.write(f"{day},{lo},{hi}\n")
    print(f"    downloaded {len(records)} days")
except OSError as err:
    print(f"    download failed ({err}); reading the committed CSV")
    rows = CSV.read_text().strip().splitlines()[1:]
    records = [(d, float(a), float(b))
               for d, a, b in (r.split(",") for r in rows)]

check("[B-data] 366 days for 2024", len(records) == 366)
check("[B-data] no day is missing a temperature",
      all(lo is not None and hi is not None for _, lo, hi in records))
X_all = np.array([[lo, hi] for _, lo, hi in records], dtype=float)
dates_all = [d for d, _, _ in records]
m_all = len(X_all)


# ---- the two constructions of a similarity graph
def pairwise_distances(X):
    """Euclidean distance between every pair of rows of X."""
    diff = X[:, None, :] - X[None, :, :]
    return np.sqrt(np.sum(diff ** 2, axis=-1))


def gaussian_weights(D, sigma):
    """Gaussian weight exp(-d^2 / (2 sigma^2)) for every pair, zero on
    the diagonal (no self-loops)."""
    W = np.exp(-D ** 2 / (2.0 * sigma ** 2))
    np.fill_diagonal(W, 0.0)
    return W


def knn_mask(D, k):
    """Symmetric 0/1 matrix: entry (i, i') is 1 when i' is among the k
    nearest neighbors of i or i among the k nearest of i'."""
    n = len(D)
    Dn = D.copy()
    np.fill_diagonal(Dn, np.inf)
    nearest = np.argsort(Dn, axis=1)[:, :k]
    M = np.zeros((n, n), dtype=int)
    for i in range(n):
        M[i, nearest[i]] = 1
    return np.maximum(M, M.T)


def knn_width(D, k):
    """Mean distance of a node to its k-th nearest neighbor."""
    Dn = D.copy()
    np.fill_diagonal(Dn, np.inf)
    return float(np.mean(np.sort(Dn, axis=1)[:, k - 1]))
[B-data] daily minimum and maximum temperature at Krems, 2024
    downloaded 366 days
  [ok] [B-data] 366 days for 2024
  [ok] [B-data] no day is missing a temperature
Every 37th day of the year gives the ten nodes, numbered 1 to 10 in order of date.
print("[B-days] every 37th day of 2024 as the ten nodes")
idx = np.arange(0, m_all, 37)
X = X_all[idx]
dates = [dates_all[i] for i in idx]
n = len(X)
check(f"[B-days] {n} nodes: " + ", ".join(dates), n == 10)
check("[B-days] the ten feature vectors are distinct",
      len({tuple(x) for x in X}) == n)
[B-days] every 37th day of 2024 as the ten nodes
  [ok] [B-days] 10 nodes: 2024-01-01, 2024-02-07, 2024-03-15, 2024-04-21, 2024-05-28, 2024-07-04, 2024-08-10, 2024-09-16, 2024-10-23, 2024-11-29
  [ok] [B-days] the ten feature vectors are distinct
Gaussian weights for all 45 pairs of days, with the width set to the mean distance of a day to its third nearest neighbor; the 3-nearest-neighbor graph keeps an edge when one day is among the three nearest of the other. Weight matrix: symmetric, zero diagonal, nonnegative; edges = positive entries; row sums = weighted degrees; the unweighted graph has entries 0 and 1.
print("[B-weights] Gaussian weights and the 3-nearest-neighbor graph")
K = 3
D = pairwise_distances(X)
sigma = knn_width(D, K)
W_full = gaussian_weights(D, sigma)
M_knn = knn_mask(D, K)
W = W_full * M_knn
iu = np.triu_indices(n, k=1)
n_pairs = len(iu[0])
n_edges = int(np.sum(M_knn[iu]))
check(f"[B-weights] width sigma = {sigma:.2f} degrees (mean distance to "
      f"the {K}rd nearest neighbor)", 2 < sigma < 15)
check(f"[B-weights] the fully connected graph has a positive weight on "
      f"all {n_pairs} pairs", n_pairs == 45 and np.all(W_full[iu] > 0))
check(f"[B-weights] the {K}-nearest-neighbor graph keeps {n_edges} of the "
      f"{n_pairs} pairs as edges", n * K / 2 <= n_edges <= n * K)
check("[B-weights] the weight matrix is symmetric", np.allclose(W, W.T))
check("[B-weights] its diagonal is zero (no self-loops)",
      np.all(np.diag(W) == 0))
check("[B-weights] its entries are nonnegative", np.all(W >= 0))
check("[B-weights] the edge set is the set of positive entries",
      np.array_equal((W > 0).astype(int), M_knn))
deg = W.sum(axis=1)
check("[B-weights] a row sum of the weight matrix is the weighted degree "
      "of the node, the sum of the weights of its edges",
      np.allclose(deg, [W[i, M_knn[i] == 1].sum() for i in range(n)]))
check("[B-weights] the unweighted graph has the entries 0 and 1 only",
      set(np.unique(M_knn)) == {0, 1})
w_edges = W[iu][M_knn[iu] == 1]
n_strong = int(np.sum(w_edges >= 0.5))
check(f"[B-weights] edge weights between {w_edges.min():.2f} and "
      f"{w_edges.max():.2f}; {n_strong} edges weigh at least 0.5 and "
      f"{n_edges - n_strong} less", 0 < n_strong < n_edges)
i_max, i_min = int(np.argmax(deg)), int(np.argmin(deg))
check(f"[B-weights] weighted degrees from {deg[i_min]:.2f} (node "
      f"{i_min + 1}, {dates[i_min]}) to {deg[i_max]:.2f} (node {i_max + 1}, "
      f"{dates[i_max]}); unweighted degrees from {M_knn.sum(1).min()} to "
      f"{M_knn.sum(1).max()}", deg[i_min] > 0)
[B-weights] Gaussian weights and the 3-nearest-neighbor graph
  [ok] [B-weights] width sigma = 8.27 degrees (mean distance to the 3rd nearest neighbor)
  [ok] [B-weights] the fully connected graph has a positive weight on all 45 pairs
  [ok] [B-weights] the 3-nearest-neighbor graph keeps 19 of the 45 pairs as edges
  [ok] [B-weights] the weight matrix is symmetric
  [ok] [B-weights] its diagonal is zero (no self-loops)
  [ok] [B-weights] its entries are nonnegative
  [ok] [B-weights] the edge set is the set of positive entries
  [ok] [B-weights] a row sum of the weight matrix is the weighted degree of the node, the sum of the weights of its edges
  [ok] [B-weights] the unweighted graph has the entries 0 and 1 only
  [ok] [B-weights] edge weights between 0.11 and 0.95; 16 edges weigh at least 0.5 and 3 less
  [ok] [B-weights] weighted degrees from 1.13 (node 7, 2024-08-10) to 4.61 (node 2, 2024-02-07); unweighted degrees from 3 to 6
The cold days (maximum temperature below 18 degrees) and the warm days: the edges between the two sets carry a smaller share of the weight than of the edges.
print("[B-cut] the edges between the cold and the warm days")
THRESH = 18.0
cold = X[:, 1] < THRESH
n_cold, n_warm = int(cold.sum()), int((~cold).sum())
cut = float(W[cold][:, ~cold].sum())
within_cold = float(W[cold][:, cold].sum() / 2)
within_warm = float(W[~cold][:, ~cold].sum() / 2)
total = float(W[iu].sum())
n_cut = int(M_knn[cold][:, ~cold].sum())
check(f"[B-cut] {n_cold} cold days (nodes "
      + ", ".join(str(i + 1) for i in np.flatnonzero(cold))
      + f") and {n_warm} warm days", n_cold >= 3 and n_warm >= 3)
check(f"[B-cut] {n_cut} of the {n_edges} edges ({100 * n_cut / n_edges:.1f}%) "
      f"join a cold with a warm day; they carry {cut:.2f} of the total "
      f"weight {total:.2f} ({100 * cut / total:.1f}%), so they are lighter "
      f"than the average edge (inside the cold days {within_cold:.2f}, "
      f"inside the warm days {within_warm:.2f})",
      cut / total < n_cut / n_edges)
[B-cut] the edges between the cold and the warm days
  [ok] [B-cut] 7 cold days (nodes 1, 2, 3, 4, 8, 9, 10) and 3 warm days
  [ok] [B-cut] 4 of the 19 edges (21.1%) join a cold with a warm day; they carry 1.92 of the total weight 13.25 (14.5%), so they are lighter than the average edge (inside the cold days 9.44, inside the warm days 1.89)
The 10-nearest-neighbor graph on all 366 days: number of edges, weighted degrees, and the share of the total weight that joins a cold day with a warm day; no edge joins a January or February day with a July or August day.
print("[B-year] the 10-nearest-neighbor graph on all 366 days")
K_YEAR = 10
D_all = pairwise_distances(X_all)
sigma_all = knn_width(D_all, K_YEAR)
M_all = knn_mask(D_all, K_YEAR)
W_all = gaussian_weights(D_all, sigma_all) * M_all
iu_all = np.triu_indices(m_all, k=1)
n_edges_all = int(M_all[iu_all].sum())
deg_all = W_all.sum(axis=1)
cold_all = X_all[:, 1] < THRESH
cut_all = float(W_all[cold_all][:, ~cold_all].sum())
total_all = float(W_all[iu_all].sum())
months = np.array([int(d[5:7]) for d in dates_all])
winter = np.isin(months, [1, 2])
summer = np.isin(months, [7, 8])
check(f"[B-year] sigma = {sigma_all:.2f} degrees; {n_edges_all} edges on "
      f"{m_all} nodes, out of {len(iu_all[0])} pairs",
      m_all * K_YEAR / 2 <= n_edges_all <= m_all * K_YEAR)
check(f"[B-year] weighted degrees from {deg_all.min():.2f} to "
      f"{deg_all.max():.2f}", deg_all.min() > 0)
check(f"[B-year] {int(cold_all.sum())} cold and {int((~cold_all).sum())} "
      f"warm days; the edges between them carry {100 * cut_all / total_all:.1f}% "
      f"of the total weight", cut_all / total_all < 0.1)
check("[B-year] no edge joins a January or February day with a July or "
      "August day", M_all[winter][:, summer].sum() == 0)
[B-year] the 10-nearest-neighbor graph on all 366 days
  [ok] [B-year] sigma = 2.09 degrees; 2209 edges on 366 nodes, out of 66795 pairs
  [ok] [B-year] weighted degrees from 1.40 to 14.05
  [ok] [B-year] 186 cold and 180 warm days; the edges between them carry 3.7% of the total weight
  [ok] [B-year] no edge joins a January or February day with a July or August day
CSVs for the figure (nodes, edges in two weight classes, the weight matrix) and the matplotlib preview.
print("[B-plot] nodes, edges in two weight classes, weight matrix")
with open(OUT_DIR / "weightedgraph_nodes.csv", "w") as fh:
    fh.write("node,date,tmin,tmax\n")
    for i in range(n):
        fh.write(f"{i + 1},{dates[i]},{X[i, 0]:.1f},{X[i, 1]:.1f}\n")
with open(OUT_DIR / "weightedgraph_pairs.csv", "w") as fh:
    fh.write("i,ip,distance,w_full,w_knn\n")
    for i, ip in zip(*iu):
        fh.write(f"{i + 1},{ip + 1},{D[i, ip]:.3f},{W_full[i, ip]:.4f},"
                 f"{W[i, ip]:.4f}\n")
strong, weak = [], []
for i, ip in zip(*iu):
    if M_knn[i, ip]:
        (strong if W[i, ip] >= 0.5 else weak).append((i, ip))
for name, edges in (("strong", strong), ("weak", weak)):
    with open(OUT_DIR / f"weightedgraph_edges_{name}.csv", "w") as fh:
        fh.write("x,y\n")
        for i, ip in edges:
            fh.write(f"{X[i, 0]:.1f},{X[i, 1]:.1f}\n"
                     f"{X[ip, 0]:.1f},{X[ip, 1]:.1f}\nnan,nan\n")
with open(OUT_DIR / "weightedgraph_matrix.csv", "w") as fh:
    fh.write("i,ip,w\n")
    for i in range(n):
        for ip in range(n):
            fh.write(f"{i + 1},{ip + 1},{W[i, ip]:.4f}\n")
check(f"[B-plot] {len(strong)} strong and {len(weak)} weak edges written, "
      f"{n_edges} in all", len(strong) + len(weak) == n_edges)

fig, (ax1, ax2) = plt.subplots(1, 2, figsize=(9.6, 4.2),
                               gridspec_kw={"width_ratios": [1.15, 1]})
for i, ip in strong:
    ax1.plot(X[[i, ip], 0], X[[i, ip], 1], color="black", lw=1.8)
for i, ip in weak:
    ax1.plot(X[[i, ip], 0], X[[i, ip], 1], color="0.55", lw=0.7)
ax1.plot([], [], color="black", lw=1.8, label="edge weight at least 0.5")
ax1.plot([], [], color="0.55", lw=0.7, label="edge weight below 0.5")
ax1.scatter(X[:, 0], X[:, 1], marker="o", color="black", s=30,
            label="the ten days (nodes)", zorder=3)
for i in range(n):
    ax1.annotate(str(i + 1), (X[i, 0], X[i, 1]), textcoords="offset points",
                 xytext=(4, 4), fontsize=8)
ax1.set_xlabel("morning minimum temperature (°C)")
ax1.set_ylabel("maximum daytime temperature (°C)")
ax1.set_title("3-nearest-neighbor graph on ten days of 2024")
ax1.legend(frameon=False, fontsize=8, loc="upper left")
im = ax2.imshow(W, cmap="Greys", vmin=0, vmax=1, origin="upper",
                extent=(0.5, n + 0.5, n + 0.5, 0.5))
ax2.set_xticks(range(1, n + 1))
ax2.set_yticks(range(1, n + 1))
ax2.set_xlabel("node i'")
ax2.set_ylabel("node i")
ax2.set_title("weight matrix (dark = large weight)")
fig.colorbar(im, ax=ax2, fraction=0.046, pad=0.04, label="edge weight")
fig.tight_layout()
fig.savefig(OUT_DIR / "weightedgraph.png", dpi=110)

n_ok = sum(ok for _, ok in report)
print(f"\n{n_ok}/{len(report)} checks pass")
if n_ok != len(report):
    raise SystemExit(1)
[B-plot] nodes, edges in two weight classes, weight matrix
  [ok] [B-plot] 16 strong and 3 weak edges written, 19 in all

22/22 checks pass
B-plot writes when the script runs