B-storage writes when the script runsDictionary of Applied Machine Learning · random projection
Updated on 2026-11-19
Numerical companion to the entry random projection: it recomputes what the entry states and prints one line per check
Numerical companion to the glossary entry 'randomprojection'. Each data point is one day at Krems an der Donau (GeoSphere station 3805); its feature vector holds the daily maximum temperatures of the days up to and including it. Two window lengths give two ambient dimensions for the same m = 256 days: one year of daily maxima (d = 365) and ten years of them (d = 3650).
Run it without installing anything:uv run https://dictionaryofml.org/terms/randomprojection.py
uv downloads this script and the pinned NumPy and Matplotlib it needs, then runs it; the script fetches any input file it uses. To keep the output files, download randomprojection.py into a folder and run uv run randomprojection.py there. With NumPy and Matplotlib already installed, python3 randomprojection.py, from any directory — it writes its output files into the current directory. Fixed seeds, so the printed numbers reproduce exactly. Download randomprojection.py · Notebook · Open in Colab
Before running a downloaded copy, scan it: uvx bandit -q -t B102,B307,B602,B605 randomprojection.py (B102,B307,B602,B605 are the exec, eval and shell checks of bandit) reports nothing: the script runs no shell command and evaluates no generated code.
One cell per block of the script: the code, and what that code printed when it last ran here
"""A random projection of Krems an der Donau weather records: how much the
pairwise Euclidean distances change, and what the Johnson-Lindenstrauss
lemma guarantees.

Purpose
-------
Numerical companion to the glossary entry 'randomprojection'.  Each data
point is one day at Krems an der Donau (GeoSphere station 3805); its
feature vector holds the daily maximum temperatures of the days up to and
including it.  Two window lengths give two ambient dimensions for the same
m = 256 days: one year of daily maxima (d = 365) and ten years of them
(d = 3650).

Every feature vector is multiplied by a random matrix A of d' rows whose
entries are realizations of i.i.d. normal random variables with mean zero
and variance 1/d'.  The demo checks the identity the entry derives,
E{||A u||^2} = ||u||^2, and then measures, for each target dimension d',
the relative change of all 32640 pairwise squared distances of the 256
days.  The measured change is compared with the tolerance the
Johnson-Lindenstrauss lemma guarantees for that d', which involves the
number m of data points and not the ambient dimension d -- and the two
ambient dimensions, a factor of ten apart, indeed need the same d'.

Self-contained (numpy and matplotlib only), fixed seeds; the GeoSphere
download falls back to the committed CSV.

Blocks
------
[B-data]     Daily maximum temperature at Krems for 2005-2024 (7305 days,
             no missing value).
[B-points]   The m = 256 days, each with a one-year feature vector
             (d = 365) and a ten-year one (d = 3650).
[B-expect]   The identity E{||A u||^2} = ||u||^2 for a random matrix with
             i.i.d. entries of mean zero and variance 1/d', checked
             against the average over many draws.
[B-bound]    The Johnson-Lindenstrauss target dimension
             4 ln(m) / (eps^2/2 - eps^3/3) and the floor 24 ln(m) below
             which no tolerance eps < 1 is reachable.
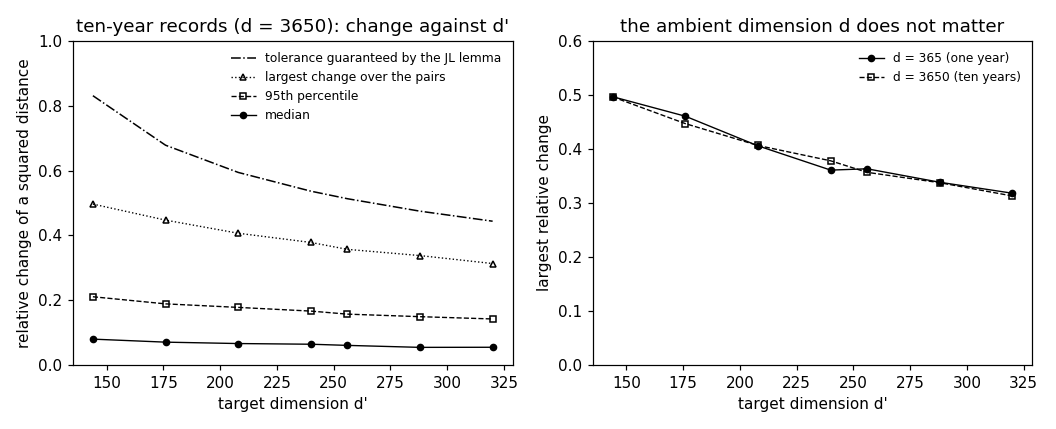
[B-distort]  The relative change of the 32640 pairwise squared distances
             for d' = 144, ..., 320, over 40 draws of A, for both ambient
             dimensions, against the guaranteed tolerance.
[B-storage]  The application: at d' = 256 a ten-year record shrinks from
             3650 numbers to 256 while no pairwise distance changes by
             more than the reported fraction.

Outputs
-------
randomprojection_weather.csv    : date, tmax for 2005-2024 (committed).
randomprojection_distortion.csv : dprime, the guaranteed tolerance eps,
                                  and the median / 95th percentile /
                                  largest relative change of the pairwise
                                  squared distances, for both ambient
                                  dimensions.
randomprojection.png            : matplotlib preview (checking only).
"""

# /// script
# requires-python = ">=3.10"
# dependencies = ["matplotlib==3.10.7", "numpy==2.3.4"]
# ///

import json
import math
import urllib.request
from pathlib import Path

import numpy as np
import matplotlib

matplotlib.use("Agg")
import matplotlib.pyplot as plt

OUT_DIR = Path(__file__).parent

SAMPLESIZE = 256                 # m, the number of days compared
STRIDE = 14                      # days between two consecutive data points
SHORT, LONG = 365, 3650          # the two ambient dimensions d
DIMS = [144, 176, 208, 240, 256, 288, 320]        # target dimensions d'
DRAWS = 40                       # independent draws of A per target dimension
DELTA = 0.05                     # failure probability allowed in the check

report = []


def check(name, ok):
    report.append((name, bool(ok)))
    print(f"  [{'ok' if ok else 'FAIL'}] {name}")
Installed 11 packages in 60ms
Daily maximum temperature at Krems for 2005-2024 (7305 days, no missing value).
print("[B-data] daily maximum temperature at Krems an der Donau, 2005-2024")
URL = ("https://dataset.api.hub.geosphere.at/v1/station/historical/"
       "klima-v2-1d?parameters=tlmax&station_ids=3805"
       "&start=2005-01-01&end=2024-12-31")
CSV = OUT_DIR / "randomprojection_weather.csv"
try:
    with urllib.request.urlopen(URL, timeout=180) as resp:
        payload = json.load(resp)
    params = payload["features"][0]["properties"]["parameters"]
    records = [(stamp[:10], hi)
               for stamp, hi in zip(payload["timestamps"],
                                    params["tlmax"]["data"])]
    with open(CSV, "w") as fh:
        fh.write("date,tmax\n")
        for day, hi in records:
            fh.write(f"{day},{hi}\n")
    print(f"    downloaded {len(records)} days")
except OSError as err:
    print(f"    download failed ({err}); reading the committed CSV")
    rows = CSV.read_text().strip().splitlines()[1:]
    records = [(d, float(v)) for d, v in (r.split(",") for r in rows)]

check("[B-data] 7305 days for 2005-2024", len(records) == 7305)
check("[B-data] no day is missing its maximum temperature",
      all(hi is not None for _, hi in records))
tmax = np.array([hi for _, hi in records], dtype=float)
dates = [d for d, _ in records]
[B-data] daily maximum temperature at Krems an der Donau, 2005-2024
    downloaded 7305 days
  [ok] [B-data] 7305 days for 2005-2024
  [ok] [B-data] no day is missing its maximum temperature
The m = 256 days, each with a one-year feature vector (d = 365) and a ten-year one (d = 3650).
print("[B-points] the 256 days, with a one-year and a ten-year window")
ends = LONG - 1 + np.arange(SAMPLESIZE) * STRIDE
check(f"[B-points] the {SAMPLESIZE} days run from {dates[ends[0]]} to "
      f"{dates[ends[-1]]}, every {STRIDE}th day", ends[-1] < len(tmax))


def windows(length):
    """Feature vectors: the `length` daily maxima up to each chosen day."""
    return np.stack([tmax[e - length + 1:e + 1] for e in ends])


X = {SHORT: windows(SHORT), LONG: windows(LONG)}
check(f"[B-points] feature matrices of shape {X[SHORT].shape} and "
      f"{X[LONG].shape}",
      X[SHORT].shape == (SAMPLESIZE, SHORT)
      and X[LONG].shape == (SAMPLESIZE, LONG))
check("[B-points] the one-year window is the tail of the ten-year one",
      np.allclose(X[LONG][:, -SHORT:], X[SHORT]))
iu = np.triu_indices(SAMPLESIZE, 1)
NPAIRS = len(iu[0])
sqdist = {d: np.sum((Z[iu[0]] - Z[iu[1]]) ** 2, axis=1) for d, Z in X.items()}
check(f"[B-points] {NPAIRS} pairs of days, every squared distance positive",
      NPAIRS == SAMPLESIZE * (SAMPLESIZE - 1) // 2
      and min(sqdist[SHORT].min(), sqdist[LONG].min()) > 0)


def projection(dprime, d, rng):
    """A random matrix of d' rows with i.i.d. N(0, 1/d') entries."""
    return rng.standard_normal((dprime, d)) / math.sqrt(dprime)
[B-points] the 256 days, with a one-year and a ten-year window
  [ok] [B-points] the 256 days run from 2014-12-29 to 2024-10-07, every 14th day
  [ok] [B-points] feature matrices of shape (256, 365) and (256, 3650)
  [ok] [B-points] the one-year window is the tail of the ten-year one
  [ok] [B-points] 32640 pairs of days, every squared distance positive
The identity E{||A u||^2} = ||u||^2 for a random matrix with i.i.d. entries of mean zero and variance 1/d', checked against the average over many draws.
print("[B-expect] the expected squared length is preserved exactly")
rng = np.random.default_rng(20261119)
u = X[SHORT][0] - X[SHORT][7]
usq = float(u @ u)
lengths = [float(np.sum((projection(16, SHORT, rng) @ u) ** 2))
           for _ in range(4000)]
avg = float(np.mean(lengths))
check(f"[B-expect] squared length {usq:.1f}, average of 4000 draws with "
      f"d' = 16: {avg:.1f} ({100 * (avg / usq - 1):+.1f} percent)",
      abs(avg / usq - 1) < 0.02)
check(f"[B-expect] a single draw is far off: the 4000 draws range from "
      f"{min(lengths) / usq:.2f} to {max(lengths) / usq:.2f} times the "
      f"squared length", min(lengths) / usq < 0.5 < 1.5 < max(lengths) / usq)
[B-expect] the expected squared length is preserved exactly
  [ok] [B-expect] squared length 51555.6, average of 4000 draws with d' = 16: 51118.6 (-0.8 percent)
  [ok] [B-expect] a single draw is far off: the 4000 draws range from 0.22 to 2.68 times the squared length
The Johnson-Lindenstrauss target dimension 4 ln(m) / (eps^2/2 - eps^3/3) and the floor 24 ln(m) below which no tolerance eps < 1 is reachable.
print("[B-bound] the target dimension the lemma asks for")


def jl_dim(eps, m):
    """4 ln(m) / (eps^2/2 - eps^3/3), the lemma's lower bound on d'."""
    return 4 * math.log(m) / (eps ** 2 / 2 - eps ** 3 / 3)


def jl_eps(dprime, m):
    """The smallest tolerance eps < 1 the lemma grants at d' = dprime."""
    if dprime < 24 * math.log(m):
        return float("nan")
    lo, hi = 1e-9, 1.0
    for _ in range(200):
        mid = 0.5 * (lo + hi)
        if jl_dim(mid, m) > dprime:
            lo = mid
        else:
            hi = mid
    return hi


floor = 24 * math.log(SAMPLESIZE)
check(f"[B-bound] the denominator is largest at eps = 1, where it is 1/6, "
      f"so no eps < 1 is reachable below 24 ln(m) = {floor:.1f}",
      abs(jl_dim(1.0, SAMPLESIZE) - floor) < 1e-9)
check(f"[B-bound] eps = 1/2 asks for d' >= {jl_dim(0.5, SAMPLESIZE):.0f}, "
      f"eps = 1/4 for d' >= {jl_dim(0.25, SAMPLESIZE):.0f}",
      jl_dim(0.25, SAMPLESIZE) > jl_dim(0.5, SAMPLESIZE) > floor)
check(f"[B-bound] the bound grows only with ln(m): {SAMPLESIZE} days ask "
      f"for d' >= {jl_dim(0.5, SAMPLESIZE):.0f} at eps = 1/2, "
      f"{100 * SAMPLESIZE} days for d' >= "
      f"{jl_dim(0.5, 100 * SAMPLESIZE):.0f}",
      jl_dim(0.5, 100 * SAMPLESIZE) < 2 * jl_dim(0.5, SAMPLESIZE))
[B-bound] the target dimension the lemma asks for
  [ok] [B-bound] the denominator is largest at eps = 1, where it is 1/6, so no eps < 1 is reachable below 24 ln(m) = 133.1
  [ok] [B-bound] eps = 1/2 asks for d' >= 266, eps = 1/4 for d' >= 852
  [ok] [B-bound] the bound grows only with ln(m): 256 days ask for d' >= 266 at eps = 1/2, 25600 days for d' >= 487
The relative change of the 32640 pairwise squared distances for d' = 144, ..., 320, over 40 draws of A, for both ambient dimensions, against the guaranteed tolerance.
print("[B-distort] relative change of the 32640 pairwise squared distances")
stats = {}
for dprime in DIMS:
    for d in (SHORT, LONG):
        rng = np.random.default_rng(31415 + dprime)
        med, p95, largest = [], [], []
        for _ in range(DRAWS):
            Z = X[d] @ projection(dprime, d, rng).T
            after = np.sum((Z[iu[0]] - Z[iu[1]]) ** 2, axis=1)
            rel = np.abs(after / sqdist[d] - 1)
            med.append(np.median(rel))
            p95.append(np.percentile(rel, 95))
            largest.append(rel.max())
        stats[(dprime, d)] = (float(np.median(med)), float(np.median(p95)),
                              float(np.median(largest)),
                              float(np.mean(np.array(largest)
                                            < jl_eps(dprime, SAMPLESIZE))))
    eps = jl_eps(dprime, SAMPLESIZE)
    s_short, s_long = stats[(dprime, SHORT)], stats[(dprime, LONG)]
    check(f"[B-distort] d' = {dprime:3d}: guaranteed {eps:.2f}; largest "
          f"change {s_long[2]:.2f} (d = {LONG}) and {s_short[2]:.2f} "
          f"(d = {SHORT}); median {s_long[0]:.3f}",
          s_long[2] < eps and s_short[2] < eps)

held = min(stats[(dp, d)][3] for dp in DIMS for d in (SHORT, LONG))
check(f"[B-distort] the guarantee held in at least "
      f"{100 * held:.0f} percent of the {DRAWS} draws at every target "
      f"dimension, above the {100 * (1 - DELTA):.0f} percent the lemma "
      f"promises", held >= 1 - DELTA)
gaps = [abs(stats[(dp, LONG)][2] - stats[(dp, SHORT)][2]) for dp in DIMS]
check(f"[B-distort] a tenfold larger ambient dimension changes the largest "
      f"change by at most {max(gaps):.3f}", max(gaps) < 0.05)
[B-distort] relative change of the 32640 pairwise squared distances
  [ok] [B-distort] d' = 144: guaranteed 0.83; largest change 0.50 (d = 3650) and 0.50 (d = 365); median 0.080
  [ok] [B-distort] d' = 176: guaranteed 0.68; largest change 0.45 (d = 3650) and 0.46 (d = 365); median 0.070
  [ok] [B-distort] d' = 208: guaranteed 0.59; largest change 0.41 (d = 3650) and 0.41 (d = 365); median 0.066
  [ok] [B-distort] d' = 240: guaranteed 0.54; largest change 0.38 (d = 3650) and 0.36 (d = 365); median 0.064
  [ok] [B-distort] d' = 256: guaranteed 0.51; largest change 0.36 (d = 3650) and 0.36 (d = 365); median 0.060
  [ok] [B-distort] d' = 288: guaranteed 0.47; largest change 0.34 (d = 3650) and 0.34 (d = 365); median 0.054
  [ok] [B-distort] d' = 320: guaranteed 0.44; largest change 0.31 (d = 3650) and 0.32 (d = 365); median 0.054
  [ok] [B-distort] the guarantee held in at least 98 percent of the 40 draws at every target dimension, above the 95 percent the lemma promises
  [ok] [B-distort] a tenfold larger ambient dimension changes the largest change by at most 0.017
The application: at d' = 256 a ten-year record shrinks from 3650 numbers to 256 while no pairwise distance changes by more than the reported fraction.
print("[B-storage] a ten-year record kept as 256 numbers")
med, p95, largest, _ = stats[(256, LONG)]
check(f"[B-storage] d' = 256 shrinks a ten-year record from {LONG} numbers "
      f"to 256, a factor of {LONG / 256:.1f}", LONG / 256 > 14)
check(f"[B-storage] no pairwise distance changes by more than "
      f"{100 * largest:.0f} percent, half change by less than "
      f"{100 * med:.0f} percent, and nineteen of twenty by less than "
      f"{100 * p95:.0f} percent", 0 < med < p95 < largest)

# ---- CSV and preview
with open(OUT_DIR / "randomprojection_distortion.csv", "w") as fh:
    fh.write("dprime,eps,med_short,p95_short,max_short,"
             "med_long,p95_long,max_long\n")
    for dprime in DIMS:
        a, b, c, _ = stats[(dprime, SHORT)]
        e, f, g, _ = stats[(dprime, LONG)]
        fh.write(f"{dprime},{jl_eps(dprime, SAMPLESIZE):.4f},"
                 f"{a:.4f},{b:.4f},{c:.4f},{e:.4f},{f:.4f},{g:.4f}\n")

grid = np.array(DIMS, dtype=float)
eps_curve = np.array([jl_eps(dp, SAMPLESIZE) for dp in DIMS])
fig, (ax1, ax2) = plt.subplots(1, 2, figsize=(9.6, 3.9))
ax1.plot(grid, eps_curve, "k-.", lw=1.0,
         label="tolerance guaranteed by the JL lemma")
ax1.plot(grid, [stats[(dp, LONG)][2] for dp in DIMS], "k:", marker="^",
         mfc="none", ms=4, lw=0.9, label="largest change over the pairs")
ax1.plot(grid, [stats[(dp, LONG)][1] for dp in DIMS], "k--", marker="s",
         mfc="none", ms=4, lw=0.9, label="95th percentile")
ax1.plot(grid, [stats[(dp, LONG)][0] for dp in DIMS], "k-", marker="o",
         ms=4, lw=0.9, label="median")
ax1.set_ylim(0, 1.0)
ax1.set_xlabel("target dimension d'")
ax1.set_ylabel("relative change of a squared distance")
ax1.set_title("ten-year records (d = 3650): change against d'")
ax1.legend(frameon=False, fontsize=8)
ax2.plot(grid, [stats[(dp, SHORT)][2] for dp in DIMS], "k-", marker="o",
         ms=4, lw=0.9, label="d = 365 (one year)")
ax2.plot(grid, [stats[(dp, LONG)][2] for dp in DIMS], "k--", marker="s",
         mfc="none", ms=4, lw=0.9, label="d = 3650 (ten years)")
ax2.set_ylim(0, 0.6)
ax2.set_xlabel("target dimension d'")
ax2.set_ylabel("largest relative change")
ax2.set_title("the ambient dimension d does not matter")
ax2.legend(frameon=False, fontsize=8)
fig.tight_layout()
fig.savefig(OUT_DIR / "randomprojection.png", dpi=110)

n_ok = sum(ok for _, ok in report)
print(f"\n{n_ok}/{len(report)} checks pass")
if n_ok != len(report):
    raise SystemExit(1)
[B-storage] a ten-year record kept as 256 numbers
  [ok] [B-storage] d' = 256 shrinks a ten-year record from 3650 numbers to 256, a factor of 14.3
  [ok] [B-storage] no pairwise distance changes by more than 36 percent, half change by less than 6 percent, and nineteen of twenty by less than 16 percent

22/22 checks pass
B-storage writes when the script runs