B-plot writes when the script runsDictionary of Applied Machine Learning · hard clustering
Updated on 2026-11-19
Numerical companion to the entry hard clustering: it recomputes what the entry states and prints one line per check
Numerical companion to the glossary entry 'hardclustering'. The 366 days of 2024 at Krems are data points with the feature vector (morning minimum temperature, maximum daytime temperature). A hard clustering puts every day into exactly one of k clusters, so the clusters are disjoint subsets whose union is the data set. The cluster assignment is a label-like output: an index in {1, ..., k} for every day, or the one-hot vector that is the special case of a degree of belonging.
Run it without installing anything:uv run https://dictionaryofml.org/terms/hardclustering.py
uv downloads this script and the pinned NumPy and Matplotlib it needs, then runs it; the script fetches any input file it uses. To keep the output files, download hardclustering.py into a folder and run uv run hardclustering.py there. With NumPy and Matplotlib already installed, python3 hardclustering.py, from any directory — it writes its output files into the current directory. Fixed seeds, so the printed numbers reproduce exactly. Download hardclustering.py · Notebook · Open in Colab
Before running a downloaded copy, scan it: uvx bandit -q -t B102,B307,B602,B605 hardclustering.py (B102,B307,B602,B605 are the exec, eval and shell checks of bandit) reports nothing: the script runs no shell command and evaluates no generated code.
One cell per block of the script: the code, and what that code printed when it last ran here
"""A hard clustering of the days of one year at Krems an der Donau:
a partition of the data set, the cluster assignment as a label-like
output, and its evaluation against a reference partition.

Purpose
-------
Numerical companion to the glossary entry 'hardclustering'.  The 366
days of 2024 at Krems are data points with the feature vector (morning
minimum temperature, maximum daytime temperature).  A hard clustering
puts every day into exactly one of k clusters, so the clusters are
disjoint subsets whose union is the data set.  The cluster assignment
is a label-like output: an index in {1, ..., k} for every day, or the
one-hot vector that is the special case of a degree of belonging.

The demo checks the entry's claims: k-means with k = 2 delivers a
partition of the days into cold and warm days; the one-hot vectors
are the vertices of the probability simplex; the boundary between the
two clusters is a hyperplane, so each cluster is a convex region of the
feature space; the cluster indices carry no meaning beyond the
partition, so comparing the hard clustering with a reference partition
(the cold half-year Oct-Mar and the warm half-year Apr-Sep) uses the
best matching of the indices or counts pairs of days, which is the Rand
index; and with k = 4 against the four seasons the agreement is lower,
because spring and autumn days have the same temperatures.

Deterministic: Lloyd's algorithm starts from k-means++ seeds drawn with
a fixed seed.  Self-contained: numpy + matplotlib only; the GeoSphere
download falls back to the committed CSV.

Blocks
------
[B-data]       Download the daily minimum and maximum temperature of
               2024 at Krems (GeoSphere station 3805) or read the
               committed copy; 366 days, no missing value.
[B-partition]  k-means with k = 2: the two clusters are disjoint and
               cover every day, and the one-hot vectors of the days have
               exactly one entry 1 and sum to 1.
[B-boundary]   The boundary between the two clusters is the
               perpendicular bisector of the two centroids: every day
               lies on the side of its own centroid.
[B-eval]       The hard clustering against the reference partition
               into half-years: contingency table, best-matching
               accuracy, and the Rand index, which does not change when
               the cluster indices are swapped.
[B-seasons]    k = 4 against the four seasons: the best-matching
               accuracy drops, since spring and autumn days share one
               cluster.
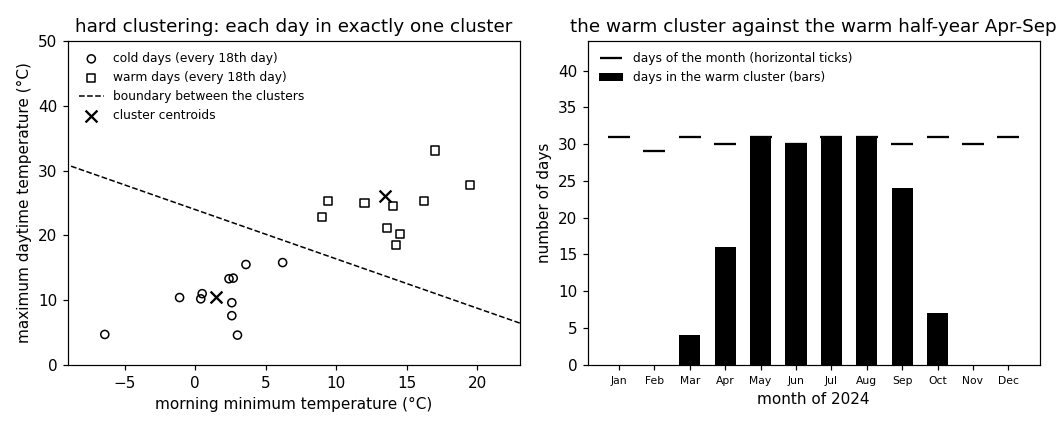
[B-plot]       Every 18th day for the figure (21 of 366 days) with its
               cluster, the two centroids, the boundary, and the
               per-month counts of days in the warm cluster.

Outputs
-------
hardclustering_weather.csv      : date, tmin, tmax (committed copy).
hardclustering_points_plot.csv  : the 21 drawn days with their cluster.
hardclustering_centroids.csv    : the two centroids (k = 2).
hardclustering_boundary.csv     : two points on the boundary line.
hardclustering_months.csv       : month, days, days in the warm cluster.
hardclustering.png              : matplotlib preview (checking only).
"""

# /// script
# requires-python = ">=3.10"
# dependencies = ["matplotlib==3.10.7", "numpy==2.3.4"]
# ///

import itertools
import json
import urllib.request
from pathlib import Path

import numpy as np
import matplotlib

matplotlib.use("Agg")
import matplotlib.pyplot as plt

OUT_DIR = Path(__file__).parent

report = []


def check(name, ok):
    report.append((name, bool(ok)))
    print(f"  [{'ok' if ok else 'FAIL'}] {name}")
Download the daily minimum and maximum temperature of 2024 at Krems (GeoSphere station 3805) or read the committed copy; 366 days, no missing value.
print("[B-data] daily minimum and maximum temperature at Krems, 2024")
URL = ("https://dataset.api.hub.geosphere.at/v1/station/historical/"
       "klima-v2-1d?parameters=tlmin,tlmax&station_ids=3805"
       "&start=2024-01-01&end=2024-12-31")
CSV = OUT_DIR / "hardclustering_weather.csv"
try:
    with urllib.request.urlopen(URL, timeout=120) as resp:
        payload = json.load(resp)
    params = payload["features"][0]["properties"]["parameters"]
    records = [(stamp[:10], lo, hi)
               for stamp, lo, hi in zip(payload["timestamps"],
                                        params["tlmin"]["data"],
                                        params["tlmax"]["data"])]
    with open(CSV, "w") as fh:
        fh.write("date,tmin,tmax\n")
        for day, lo, hi in records:
            fh.write(f"{day},{lo},{hi}\n")
    print(f"    downloaded {len(records)} days")
except OSError as err:
    print(f"    download failed ({err}); reading the committed CSV")
    rows = CSV.read_text().strip().splitlines()[1:]
    records = [(d, float(a), float(b))
               for d, a, b in (r.split(",") for r in rows)]

check("[B-data] 366 days for 2024", len(records) == 366)
check("[B-data] no day is missing a temperature",
      all(lo is not None and hi is not None for _, lo, hi in records))
X = np.array([[lo, hi] for _, lo, hi in records], dtype=float)
m = len(X)
months = np.array([int(d[5:7]) for d, _, _ in records])


# ---- k-means: Lloyd's algorithm from k-means++ seeds
def sq_euclid(x, w):
    return np.sum((x - w) ** 2, axis=-1)


def assign(X, W):
    """Index of the nearest centroid for every data point."""
    return np.argmin(np.stack([sq_euclid(X, w) for w in W], axis=1), axis=1)


def clustering_error(X, W):
    return float(np.mean(np.min(np.stack([sq_euclid(X, w) for w in W],
                                         axis=1), axis=1)))


def lloyd(X, W0, max_iter=500):
    W = np.array(W0, dtype=float)
    c = assign(X, W)
    for _ in range(max_iter):
        W = np.array([X[c == j].mean(axis=0) if np.any(c == j) else W[j]
                      for j in range(len(W))])
        c_new = assign(X, W)
        if np.array_equal(c_new, c):
            break
        c = c_new
    return W, c


def kmeanspp_seeds(X, k, rng):
    W = [X[rng.integers(m)]]
    for _ in range(1, k):
        d2 = np.min(np.stack([sq_euclid(X, w) for w in W], axis=1), axis=1)
        W.append(X[rng.choice(m, p=d2 / d2.sum())])
    return np.array(W)


def kmeans(X, k, seed, restarts=20):
    """Smallest clustering error over k-means++ restarts."""
    rng = np.random.default_rng(seed)
    best = None
    for _ in range(restarts):
        W, c = lloyd(X, kmeanspp_seeds(X, k, rng))
        err = clustering_error(X, W)
        if best is None or err < best[2]:
            best = (W, c, err)
    return best
[B-data] daily minimum and maximum temperature at Krems, 2024
    downloaded 366 days
  [ok] [B-data] 366 days for 2024
  [ok] [B-data] no day is missing a temperature
k-means with k = 2: the two clusters are disjoint and cover every day, and the one-hot vectors of the days have exactly one entry 1 and sum to 1.
print("[B-partition] k-means with k = 2 delivers a partition of the days")
W2, c2, err2 = kmeans(X, 2, seed=2024)
cold, warm = sorted(range(2), key=lambda j: W2[j, 1])
clusters = [set(np.flatnonzero(c2 == j)) for j in range(2)]
check(f"[B-partition] the two clusters are disjoint and cover all {m} days "
      f"({len(clusters[cold])} cold days, {len(clusters[warm])} warm days)",
      not (clusters[0] & clusters[1])
      and clusters[0] | clusters[1] == set(range(m)))
check(f"[B-partition] cold days: centroid ({W2[cold, 0]:.1f}, "
      f"{W2[cold, 1]:.1f}); warm days: centroid ({W2[warm, 0]:.1f}, "
      f"{W2[warm, 1]:.1f}); clustering error {err2:.1f}",
      W2[cold, 1] < W2[warm, 1])
U = np.zeros((m, 2))
U[np.arange(m), c2] = 1.0
check("[B-partition] the one-hot vector of every day has entries in {0, 1} "
      "and sums to 1: a vertex of the probability simplex",
      np.all(np.isin(U, (0.0, 1.0))) and np.all(U.sum(axis=1) == 1.0)
      and np.all(U.max(axis=1) == 1.0))
check("[B-partition] the cluster index of a day is the position of the 1 "
      "in its one-hot vector", np.array_equal(np.argmax(U, axis=1), c2))
[B-partition] k-means with k = 2 delivers a partition of the days
  [ok] [B-partition] the two clusters are disjoint and cover all 366 days (192 cold days, 174 warm days)
  [ok] [B-partition] cold days: centroid (1.5, 10.5); warm days: centroid (13.4, 26.1); clustering error 42.0
  [ok] [B-partition] the one-hot vector of every day has entries in {0, 1} and sums to 1: a vertex of the probability simplex
  [ok] [B-partition] the cluster index of a day is the position of the 1 in its one-hot vector
The boundary between the two clusters is the perpendicular bisector of the two centroids: every day lies on the side of its own centroid.
print("[B-boundary] the two clusters are separated by a straight line")
mid = W2.mean(axis=0)
normal = W2[warm] - W2[cold]
side = (X - mid) @ normal          # > 0 on the warm side
check("[B-boundary] every day lies on the side of the perpendicular "
      "bisector of the centroids that holds its own centroid",
      np.all((side > 0) == (c2 == warm)) and np.all(side != 0))
closest = int(np.argmin(np.abs(side) / np.linalg.norm(normal)))
check(f"[B-boundary] the day nearest the boundary, {records[closest][0]}, "
      f"is {np.abs(side[closest]) / np.linalg.norm(normal):.2f} degrees "
      "from it", True)
# two points on the line, where it leaves the plotting window
direction = np.array([-normal[1], normal[0]]) / np.linalg.norm(normal)
t_lo, t_hi = -np.inf, np.inf
for lo, hi, j in ((-9.0, 23.0, 0), (0.0, 50.0, 1)):
    t_a, t_b = sorted(((lo - mid[j]) / direction[j],
                       (hi - mid[j]) / direction[j]))
    t_lo, t_hi = max(t_lo, t_a), min(t_hi, t_b)
boundary = np.array([mid + t_lo * direction, mid + t_hi * direction])
[B-boundary] the two clusters are separated by a straight line
  [ok] [B-boundary] every day lies on the side of the perpendicular bisector of the centroids that holds its own centroid
  [ok] [B-boundary] the day nearest the boundary, 2024-03-28, is 0.22 degrees from it
The hard clustering against the reference partition into half-years: contingency table, best-matching accuracy, and the Rand index, which does not change when the cluster indices are swapped.
print("[B-eval] the hard clustering against the half-years Oct-Mar / Apr-Sep")
ref2 = np.isin(months, [4, 5, 6, 7, 8, 9]).astype(int)   # 1 = warm half-year
check(f"[B-eval] the reference partition has {np.sum(ref2 == 0)} days in "
      f"the cold half-year and {np.sum(ref2 == 1)} in the warm one",
      np.sum(ref2 == 0) == 183 and np.sum(ref2 == 1) == 183)
table = np.array([[np.sum((c2 == a) & (ref2 == b)) for b in (0, 1)]
                  for a in (cold, warm)])
check(f"[B-eval] contingency table (rows: cold, warm cluster; columns: "
      f"cold, warm half-year): {table.tolist()}", table.sum() == m)


def best_matching_accuracy(c, ref, k):
    """Largest fraction of agreeing days over all bijections of the
    cluster indices onto the reference indices."""
    best = 0.0
    for perm in itertools.permutations(range(k)):
        relabeled = np.array(perm)[c]
        best = max(best, float(np.mean(relabeled == ref)))
    return best


acc2 = best_matching_accuracy(c2, ref2, 2)
raw_agree = float(np.mean(c2 == ref2))
swapped = float(np.mean((1 - c2) == ref2))
check(f"[B-eval] best-matching accuracy {100 * acc2:.1f}%: the indices as "
      f"found agree on {100 * raw_agree:.1f}% of the days, swapped on "
      f"{100 * swapped:.1f}%", abs(acc2 - max(raw_agree, swapped)) < 1e-12)


def pair_counts(c, ref):
    """Numbers of pairs of data points in the same cluster in both
    partitions (a), in the same cluster only in c (b), only in ref (d),
    and in different clusters in both (e)."""
    same_c = c[:, None] == c[None, :]
    same_r = ref[:, None] == ref[None, :]
    upper = np.triu(np.ones((len(c), len(c)), dtype=bool), 1)
    a = int(np.sum(same_c & same_r & upper))
    b = int(np.sum(same_c & ~same_r & upper))
    d = int(np.sum(~same_c & same_r & upper))
    e = int(np.sum(~same_c & ~same_r & upper))
    return a, b, d, e


def rand_index(c, ref):
    a, b, d, e = pair_counts(c, ref)
    return (a + e) / (a + b + d + e)


a, b, d, e = pair_counts(c2, ref2)
ri2 = rand_index(c2, ref2)
check(f"[B-eval] of the {m * (m - 1) // 2} pairs of days, {a} are together "
      f"in both partitions and {e} apart in both; Rand index "
      f"{ri2:.3f}", a + b + d + e == m * (m - 1) // 2)
check("[B-eval] the Rand index from the contingency table equals the pair "
      "count",
      abs(ri2 - (sum(n * (n - 1) // 2 for n in table.ravel()) * 2
                 - sum(n * (n - 1) // 2 for n in table.sum(axis=1))
                 - sum(n * (n - 1) // 2 for n in table.sum(axis=0))
                 + m * (m - 1) // 2) / (m * (m - 1) // 2)) < 1e-12)
check("[B-eval] swapping the two cluster indices leaves the Rand index "
      "unchanged", abs(rand_index(1 - c2, ref2) - ri2) < 1e-12)
check("[B-eval] a reference partition compared with itself has Rand "
      "index 1", rand_index(ref2, ref2) == 1.0)
whole = [mo for mo in range(1, 13)
         if len(set(c2[months == mo])) == 1]
names = ["Jan", "Feb", "Mar", "Apr", "May", "Jun", "Jul", "Aug", "Sep",
         "Oct", "Nov", "Dec"]
whole_cold = [names[mo - 1] for mo in whole if c2[months == mo][0] == cold]
whole_warm = [names[mo - 1] for mo in whole if c2[months == mo][0] == warm]
check(f"[B-eval] months entirely in the cold cluster: {whole_cold}; "
      f"entirely in the warm cluster: {whole_warm}", len(whole) >= 4)
warm_per_month = np.array([int(np.sum(c2[months == mo] == warm))
                           for mo in range(1, 13)])
days_per_month = np.array([int(np.sum(months == mo)) for mo in range(1, 13)])
mixed = [f"{names[mo - 1]} {warm_per_month[mo - 1]}/{days_per_month[mo - 1]}"
         for mo in range(1, 13)
         if 0 < warm_per_month[mo - 1] < days_per_month[mo - 1]]
check(f"[B-eval] days in the warm cluster in the mixed months: {mixed}",
      len(mixed) >= 2)
[B-eval] the hard clustering against the half-years Oct-Mar / Apr-Sep
  [ok] [B-eval] the reference partition has 183 days in the cold half-year and 183 in the warm one
  [ok] [B-eval] contingency table (rows: cold, warm cluster; columns: cold, warm half-year): [[172, 20], [11, 163]]
  [ok] [B-eval] best-matching accuracy 91.5%: the indices as found agree on 91.5% of the days, swapped on 8.5%
  [ok] [B-eval] of the 66795 pairs of days, 28154 are together in both partitions and 28256 apart in both; Rand index 0.845
  [ok] [B-eval] the Rand index from the contingency table equals the pair count
  [ok] [B-eval] swapping the two cluster indices leaves the Rand index unchanged
  [ok] [B-eval] a reference partition compared with itself has Rand index 1
  [ok] [B-eval] months entirely in the cold cluster: ['Jan', 'Feb', 'Nov', 'Dec']; entirely in the warm cluster: ['May', 'Jun', 'Jul', 'Aug']
  [ok] [B-eval] days in the warm cluster in the mixed months: ['Mar 4/31', 'Apr 16/30', 'Sep 24/30', 'Oct 7/31']
k = 4 against the four seasons: the best-matching accuracy drops, since spring and autumn days share one cluster.
print("[B-seasons] k = 4 against the seasons DJF, MAM, JJA, SON")
W4, c4, err4 = kmeans(X, 4, seed=2024)
season = np.array([{12: 0, 1: 0, 2: 0, 3: 1, 4: 1, 5: 1, 6: 2, 7: 2, 8: 2,
                    9: 3, 10: 3, 11: 3}[mo] for mo in months])
acc4 = best_matching_accuracy(c4, season, 4)
ri4 = rand_index(c4, season)
check(f"[B-seasons] clustering error {err4:.1f}; best-matching accuracy "
      f"{100 * acc4:.1f}% and Rand index {ri4:.3f}, both below the k = 2 "
      f"values", acc4 < acc2 and ri4 < ri2)
# the cluster that holds most spring days: how many of its days are autumn?
spring_cluster = int(np.argmax([np.sum((c4 == j) & (season == 1))
                                for j in range(4)]))
in_cl = c4 == spring_cluster
share = {names_s: float(np.mean(season[in_cl] == s))
         for names_s, s in (("spring", 1), ("autumn", 3))}
check(f"[B-seasons] the cluster with most spring days holds {np.sum(in_cl)} "
      f"days, {100 * share['spring']:.0f}% of them spring and "
      f"{100 * share['autumn']:.0f}% autumn days", share["autumn"] > 0.2)
[B-seasons] k = 4 against the seasons DJF, MAM, JJA, SON
  [ok] [B-seasons] clustering error 17.0; best-matching accuracy 59.6% and Rand index 0.741, both below the k = 2 values
  [ok] [B-seasons] the cluster with most spring days holds 89 days, 55% of them spring and 25% autumn days
Every 18th day for the figure (21 of 366 days) with its cluster, the two centroids, the boundary, and the per-month counts of days in the warm cluster.
print("[B-plot] thinned scatter, centroids, boundary, per-month counts")
idx = np.arange(0, m, 18)
with open(OUT_DIR / "hardclustering_points_plot.csv", "w") as fh:
    fh.write("tmin,tmax,cluster\n")
    for i in idx:
        fh.write(f"{X[i, 0]:.1f},{X[i, 1]:.1f},{int(c2[i] == warm)}\n")
check(f"[B-plot] every 18th day: {len(idx)} of the {m} days are drawn",
      len(idx) == 21)
with open(OUT_DIR / "hardclustering_centroids.csv", "w") as fh:
    fh.write("cluster,tmin,tmax\n")
    for lab, j in ((0, cold), (1, warm)):
        fh.write(f"{lab},{W2[j, 0]:.4f},{W2[j, 1]:.4f}\n")
with open(OUT_DIR / "hardclustering_boundary.csv", "w") as fh:
    fh.write("tmin,tmax\n")
    for p in boundary:
        fh.write(f"{p[0]:.4f},{p[1]:.4f}\n")
with open(OUT_DIR / "hardclustering_months.csv", "w") as fh:
    fh.write("month,name,days,warmdays,colddays\n")
    for mo in range(1, 13):
        fh.write(f"{mo},{names[mo - 1]},{days_per_month[mo - 1]},"
                 f"{warm_per_month[mo - 1]},"
                 f"{days_per_month[mo - 1] - warm_per_month[mo - 1]}\n")

fig, (ax1, ax2) = plt.subplots(1, 2, figsize=(9.6, 3.9))
for j, mk, lab in ((cold, "o", "cold days"), (warm, "s", "warm days")):
    sel = idx[c2[idx] == j]
    ax1.scatter(X[sel, 0], X[sel, 1], marker=mk, facecolors="none",
                edgecolors="black", s=28, label=f"{lab} (every 18th day)")
ax1.plot(boundary[:, 0], boundary[:, 1], "k--", lw=1,
         label="boundary between the clusters")
ax1.scatter(W2[:, 0], W2[:, 1], marker="x", color="black", s=60,
            label="cluster centroids")
ax1.set_xlim(-9, 23)
ax1.set_ylim(0, 50)
ax1.set_xlabel("morning minimum temperature (°C)")
ax1.set_ylabel("maximum daytime temperature (°C)")
ax1.set_title("hard clustering: each day in exactly one cluster")
ax1.legend(frameon=False, fontsize=8, loc="upper left")
pos = np.arange(1, 13)
ax2.bar(pos, warm_per_month, width=0.6, color="black",
        label="days in the warm cluster (bars)")
ax2.plot(pos, days_per_month, linestyle="none", marker="_", markersize=14,
         markeredgewidth=1.5, color="black",
         label="days of the month (horizontal ticks)")
ax2.set_xticks(pos)
ax2.set_xticklabels(names, fontsize=7)
ax2.set_ylim(0, 44)
ax2.set_xlabel("month of 2024")
ax2.set_ylabel("number of days")
ax2.set_title("the warm cluster against the warm half-year Apr-Sep")
ax2.legend(frameon=False, fontsize=8, loc="upper left")
fig.tight_layout()
fig.savefig(OUT_DIR / "hardclustering.png", dpi=110)

n_ok = sum(ok for _, ok in report)
print(f"\n{n_ok}/{len(report)} checks pass")
if n_ok != len(report):
    raise SystemExit(1)
[B-plot] thinned scatter, centroids, boundary, per-month counts
  [ok] [B-plot] every 18th day: 21 of the 366 days are drawn

20/20 checks pass
B-plot writes when the script runs