B-plot writes when the script runsDictionary of Applied Machine Learning · graph clustering
Updated on 2026-11-19
Numerical companion to the entry graph clustering: it recomputes what the entry states and prints one line per check
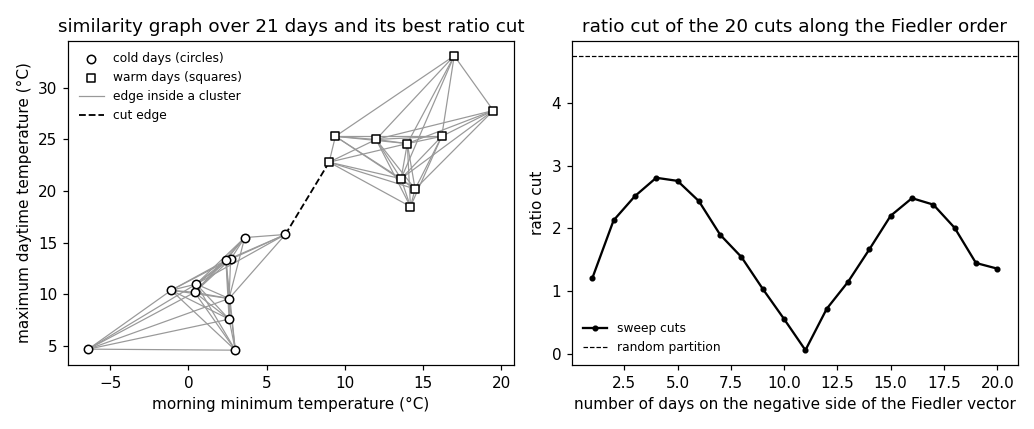
Numerical companion to the glossary entry 'graphclustering'. Every 18th day of 2024 at Krems (21 days) is a data point with the feature vector (morning minimum temperature, maximum daytime temperature). The days are the nodes of a weighted graph: two days are connected if one is among the six nearest neighbors of the other, and the edge weight is the Gaussian similarity exp(-||x - x'||^2 / (2 sigma^2)) of their feature vectors with sigma = 5 degrees Celsius.
Run it without installing anything:uv run https://dictionaryofml.org/terms/graphclustering.py
uv downloads this script and the pinned NumPy and Matplotlib it needs, then runs it; the script fetches any input file it uses. To keep the output files, download graphclustering.py into a folder and run uv run graphclustering.py there. With NumPy and Matplotlib already installed, python3 graphclustering.py, from any directory — it writes its output files into the current directory. Fixed seeds, so the printed numbers reproduce exactly. Download graphclustering.py · Notebook · Open in Colab
Before running a downloaded copy, scan it: uvx bandit -q -t B102,B307,B602,B605 graphclustering.py (B102,B307,B602,B605 are the exec, eval and shell checks of bandit) reports nothing: the script runs no shell command and evaluates no generated code.
One cell per block of the script: the code, and what that code printed when it last ran here
"""Graph clustering of the days of one year at Krems an der Donau: a
similarity graph over 21 days, its cut and ratio cut, and the partition
with the smallest ratio cut.

Purpose
-------
Numerical companion to the glossary entry 'graphclustering'.  Every 18th
day of 2024 at Krems (21 days) is a data point with the feature vector
(morning minimum temperature, maximum daytime temperature).  The days are
the nodes of a weighted graph: two days are connected if one is among the
six nearest neighbors of the other, and the edge weight is the Gaussian
similarity exp(-||x - x'||^2 / (2 sigma^2)) of their feature vectors with
sigma = 5 degrees Celsius.

The demo checks the entry's claims: the cut of a cluster is the total
weight of the edges leaving it and equals a quadratic form of the
Laplacian matrix; the cut of a single day is its degree, so ranked by the
cut alone a single-day split comes second, which is why the ratio cut
divides each cut by the number of nodes in the cluster; with 21 nodes
every two-way partition can be enumerated, so the partition with the
smallest ratio cut is known exactly (here the cold and the warm days,
joined by one edge); the Fiedler vector of the Laplacian matrix orders
the nodes so that one of the 20 cuts along this order is that partition
(spectral clustering); and a random partition of the same sizes has a far
larger cut.

Deterministic: the only randomness is the random partition, drawn with a
fixed seed.  Self-contained: numpy + matplotlib only; the GeoSphere
download falls back to the committed CSV.

Blocks
------
[B-data]      Download the daily minimum and maximum temperature of 2024
              at Krems (GeoSphere station 3805) or read the committed
              copy; keep every 18th day, 21 days.
[B-graph]     The similarity graph: 6-nearest-neighbor edges with Gaussian
              edge weights; symmetric, nonnegative, connected.
[B-cut]       The cut of a cluster and its Laplacian quadratic form; the
              smallest cut over all two-way partitions; the cut of a
              single day is its degree.
[B-ratiocut]  The ratio cut; its minimizer over all 2^20 two-way
              partitions; the single-day split under the ratio cut; the
              ratio cut and cut of a random partition.
[B-spectral]  The Fiedler vector orders the nodes; the best of the 20 cuts
              along this order is the exact minimizer of the ratio cut.
[B-plot]      CSVs for the figure (nodes, edges inside the clusters, cut
              edges, the 20 sweep cuts) and the preview.

Outputs
-------
graphclustering_weather.csv      : date, tmin, tmax (committed copy).
graphclustering_nodes_plot.csv   : the 21 days with cluster and Fiedler
                                   entry.
graphclustering_edges_within.csv : edges inside a cluster as segments.
graphclustering_edges_cut.csv    : edges between the clusters as segments.
graphclustering_sweep.csv        : the 20 cuts along the Fiedler order.
graphclustering_random.csv       : the random partition's cut and ratio cut.
graphclustering.png              : matplotlib preview (checking only).
"""

# /// script
# requires-python = ">=3.10"
# dependencies = ["matplotlib==3.10.7", "numpy==2.3.4"]
# ///

import json
import urllib.request
from pathlib import Path

import numpy as np
import matplotlib

matplotlib.use("Agg")
import matplotlib.pyplot as plt

OUT_DIR = Path(__file__).parent

report = []


def check(name, ok):
    report.append((name, bool(ok)))
    print(f"  [{'ok' if ok else 'FAIL'}] {name}")
Download the daily minimum and maximum temperature of 2024 at Krems (GeoSphere station 3805) or read the committed copy; keep every 18th day, 21 days.
print("[B-data] daily minimum and maximum temperature at Krems, 2024")
URL = ("https://dataset.api.hub.geosphere.at/v1/station/historical/"
       "klima-v2-1d?parameters=tlmin,tlmax&station_ids=3805"
       "&start=2024-01-01&end=2024-12-31")
CSV = OUT_DIR / "graphclustering_weather.csv"
try:
    with urllib.request.urlopen(URL, timeout=120) as resp:
        payload = json.load(resp)
    params = payload["features"][0]["properties"]["parameters"]
    records = [(stamp[:10], lo, hi)
               for stamp, lo, hi in zip(payload["timestamps"],
                                        params["tlmin"]["data"],
                                        params["tlmax"]["data"])]
    with open(CSV, "w") as fh:
        fh.write("date,tmin,tmax\n")
        for day, lo, hi in records:
            fh.write(f"{day},{lo},{hi}\n")
    print(f"    downloaded {len(records)} days")
except OSError as err:
    print(f"    download failed ({err}); reading the committed CSV")
    rows = CSV.read_text().strip().splitlines()[1:]
    records = [(d, float(a), float(b))
               for d, a, b in (r.split(",") for r in rows)]

check("[B-data] 366 days for 2024", len(records) == 366)
check("[B-data] no day is missing a temperature",
      all(lo is not None and hi is not None for _, lo, hi in records))
STEP = 18
keep = np.arange(0, len(records), STEP)
days = [records[i] for i in keep]
X = np.array([[lo, hi] for _, lo, hi in days], dtype=float)
m = len(X)
check(f"[B-data] every {STEP}th day: {m} of the {len(records)} days are "
      f"the nodes", m == 21)
[B-data] daily minimum and maximum temperature at Krems, 2024
    downloaded 366 days
  [ok] [B-data] 366 days for 2024
  [ok] [B-data] no day is missing a temperature
  [ok] [B-data] every 18th day: 21 of the 366 days are the nodes
The similarity graph: 6-nearest-neighbor edges with Gaussian edge weights; symmetric, nonnegative, connected.
print("[B-graph] similarity graph over the 21 days")
K_NN = 6
SIGMA = 5.0
D2 = np.sum((X[:, None, :] - X[None, :, :]) ** 2, axis=2)
order = np.argsort(D2 + np.diag(np.full(m, np.inf)), axis=1)
knn = np.zeros((m, m), dtype=bool)
for i in range(m):
    knn[i, order[i, :K_NN]] = True
adjacent = knn | knn.T                       # the k-nearest neighbor graph
A = np.where(adjacent, np.exp(-D2 / (2 * SIGMA ** 2)), 0.0)
np.fill_diagonal(A, 0.0)
edges = [(i, j) for i in range(m) for j in range(i + 1, m) if adjacent[i, j]]
check(f"[B-graph] {len(edges)} edges: each day is connected to its {K_NN} "
      f"nearest neighbors and to every day that counts it among its own",
      all(adjacent[i, j] for i in range(m) for j in order[i, :K_NN]))
check("[B-graph] edge weights are symmetric and between 0 and 1",
      np.allclose(A, A.T) and np.all(A >= 0) and np.all(A <= 1)
      and all(A[i, j] > 0 for i, j in edges))
degree = A.sum(axis=1)
L = np.diag(degree) - A
check(f"[B-graph] node degrees between {degree.min():.2f} and "
      f"{degree.max():.2f}; the Laplacian matrix has zero row sums",
      np.allclose(L.sum(axis=1), 0))
# connectivity: breadth-first search from node 0
seen = {0}
frontier = [0]
while frontier:
    i = frontier.pop()
    for j in np.flatnonzero(adjacent[i]):
        if j not in seen:
            seen.add(int(j))
            frontier.append(int(j))
check("[B-graph] the graph is connected", len(seen) == m)
[B-graph] similarity graph over the 21 days
  [ok] [B-graph] 80 edges: each day is connected to its 6 nearest neighbors and to every day that counts it among its own
  [ok] [B-graph] edge weights are symmetric and between 0 and 1
  [ok] [B-graph] node degrees between 1.15 and 6.63; the Laplacian matrix has zero row sums
  [ok] [B-graph] the graph is connected
The cut of a cluster and its Laplacian quadratic form; the smallest cut over all two-way partitions; the cut of a single day is its degree.
print("[B-cut] the cut of a cluster")


def cut(mask):
    """Total weight of the edges leaving the cluster given by mask."""
    return float(A[np.ix_(mask, ~mask)].sum())


def ratio_cut(mask):
    """Ratio cut of the two-way partition {mask, ~mask}."""
    return cut(mask) * (1.0 / mask.sum() + 1.0 / (~mask).sum())


# every two-way partition: node 0 on side 0, so each partition once
codes = np.arange(1, 2 ** (m - 1), dtype=np.int64)       # nonempty side 1
bits = ((codes[:, None] >> np.arange(0, m - 1)) & 1).astype(np.int8)
side1 = np.concatenate([np.zeros((len(codes), 1), dtype=np.int8), bits],
                       axis=1)                            # node 0 on side 0
n1 = side1.sum(axis=1)
cuts = np.zeros(len(codes))
for i, j in edges:
    cuts += A[i, j] * (side1[:, i] != side1[:, j])
rcuts = cuts * (1.0 / n1 + 1.0 / (m - n1))
check(f"[B-cut] all {len(codes)} two-way partitions of the {m} days "
      f"enumerated", len(codes) == 2 ** (m - 1) - 1)

best_cut = int(np.argmin(cuts))
mask_mincut = side1[best_cut].astype(bool)
n_cross = sum(mask_mincut[i] != mask_mincut[j] for i, j in edges)
check(f"[B-cut] the smallest cut over all partitions is {cuts[best_cut]:.3f}; "
      f"it crosses {n_cross} of the {len(edges)} edges and splits the days "
      f"{mask_mincut.sum()} to {m - mask_mincut.sum()}",
      n_cross == 1 and 5 <= mask_mincut.sum() <= m - 5)
s = np.where(mask_mincut, 1.0, -1.0)
check("[B-cut] cut(C) = (1/4) s^T L s for the sign vector s of the "
      "partition", abs(cut(mask_mincut) - 0.25 * s @ L @ s) < 1e-9)
i_min = int(np.argmin(degree))
single = np.zeros(m, dtype=bool)
single[i_min] = True
rank_cut_single = int(np.sum(cuts < cut(single) - 1e-12)) + 1
check(f"[B-cut] the cut of a single day is its degree; the day with the "
      f"smallest degree ({days[i_min][0]}, degree {degree[i_min]:.3f}) has "
      f"the {rank_cut_single}nd smallest cut of all {len(codes)} partitions",
      abs(cut(single) - degree[i_min]) < 1e-9 and rank_cut_single == 2)
[B-cut] the cut of a cluster
  [ok] [B-cut] all 1048575 two-way partitions of the 21 days enumerated
  [ok] [B-cut] the smallest cut over all partitions is 0.321; it crosses 1 of the 80 edges and splits the days 10 to 11
  [ok] [B-cut] cut(C) = (1/4) s^T L s for the sign vector s of the partition
  [ok] [B-cut] the cut of a single day is its degree; the day with the smallest degree (2024-12-26, degree 1.149) has the 2nd smallest cut of all 1048575 partitions
The ratio cut; its minimizer over all 2^20 two-way partitions; the single-day split under the ratio cut; the ratio cut and cut of a random partition.
print("[B-ratiocut] the ratio cut over all two-way partitions")
best_rc = int(np.argmin(rcuts))
mask_opt = side1[best_rc].astype(bool)
cold = mask_opt if X[mask_opt, 1].mean() < X[~mask_opt, 1].mean() \
    else ~mask_opt                            # the colder side is cluster 0
warm = ~cold
rc_opt, cut_opt = ratio_cut(cold), cut(cold)
check(f"[B-ratiocut] the smallest ratio cut is {rc_opt:.3f}, for a cold "
      f"cluster of {cold.sum()} days and a warm cluster of {warm.sum()} "
      f"days; it is the partition with the smallest cut, {cut_opt:.3f}",
      abs(rcuts[best_rc] - rc_opt) < 1e-9
      and np.array_equal(mask_opt, mask_mincut))
cut_edges = [(i, j) for i, j in edges if cold[i] != cold[j]]
i_c, j_c = cut_edges[0]
check(f"[B-ratiocut] the one cut edge joins {days[i_c][0]} and "
      f"{days[j_c][0]} with weight {A[i_c, j_c]:.3f}",
      len(cut_edges) == 1 and abs(A[i_c, j_c] - cut_opt) < 1e-9)
rank_rc_single = int(np.sum(rcuts < ratio_cut(single) - 1e-12)) + 1
check(f"[B-ratiocut] splitting off the single day {days[i_min][0]} has "
      f"ratio cut {ratio_cut(single):.3f}, {ratio_cut(single) / rc_opt:.0f} "
      f"times the smallest; ranked by the ratio cut it falls from 2nd to "
      f"{rank_rc_single}th place",
      rank_rc_single > 10 and ratio_cut(single) > 10 * rc_opt)
months = np.array([int(d[0][5:7]) for d in days])
check("[B-ratiocut] every January, February, and December day is a cold "
      "day, every June, July, and August day a warm day",
      np.all(cold[np.isin(months, [1, 2, 12])])
      and np.all(warm[np.isin(months, [6, 7, 8])]))
# with 5 nearest neighbors the graph falls apart into these two clusters
knn5 = np.zeros((m, m), dtype=bool)
for i in range(m):
    knn5[i, order[i, :K_NN - 1]] = True
adj5 = knn5 | knn5.T
check(f"[B-ratiocut] with {K_NN - 1} nearest neighbors no edge joins the two "
      f"clusters: they are the connected components of that graph",
      not np.any(adj5[np.ix_(cold, warm)]))

rng = np.random.default_rng(2024)
perm = rng.permutation(m)
mask_rand = np.zeros(m, dtype=bool)
mask_rand[perm[: cold.sum()]] = True          # same sizes as the clusters
rc_rand, cut_rand = ratio_cut(mask_rand), cut(mask_rand)
n_cross_rand = sum(mask_rand[i] != mask_rand[j] for i, j in edges)
check(f"[B-ratiocut] a random partition of the same sizes cuts "
      f"{n_cross_rand} edges: cut {cut_rand:.1f} and ratio cut "
      f"{rc_rand:.2f}, {rc_rand / rc_opt:.0f} times the smallest",
      rc_rand > 20 * rc_opt)
same = n1 == cold.sum()
check(f"[B-ratiocut] over all {same.sum()} partitions of these sizes the "
      f"ratio cut averages {rcuts[same].mean():.2f}; the second smallest "
      f"is {np.sort(rcuts[same])[1]:.3f}",
      rcuts[same].mean() > 20 * rc_opt and np.sort(rcuts[same])[1] > 5 * rc_opt)
[B-ratiocut] the ratio cut over all two-way partitions
  [ok] [B-ratiocut] the smallest ratio cut is 0.061, for a cold cluster of 11 days and a warm cluster of 10 days; it is the partition with the smallest cut, 0.321
  [ok] [B-ratiocut] the one cut edge joins 2024-03-31 and 2024-10-15 with weight 0.321
  [ok] [B-ratiocut] splitting off the single day 2024-12-26 has ratio cut 1.207, 20 times the smallest; ranked by the ratio cut it falls from 2nd to 54th place
  [ok] [B-ratiocut] every January, February, and December day is a cold day, every June, July, and August day a warm day
  [ok] [B-ratiocut] with 5 nearest neighbors no edge joins the two clusters: they are the connected components of that graph
  [ok] [B-ratiocut] a random partition of the same sizes cuts 43 edges: cut 24.9 and ratio cut 4.75, 78 times the smallest
  [ok] [B-ratiocut] over all 167960 partitions of these sizes the ratio cut averages 4.67; the second smallest is 0.557
The Fiedler vector orders the nodes; the best of the 20 cuts along this order is the exact minimizer of the ratio cut.
print("[B-spectral] spectral clustering: sweep cuts along the Fiedler vector")
eigval, eigvec = np.linalg.eigh(L)
check(f"[B-spectral] eigenvalues of the Laplacian matrix: smallest "
      f"{eigval[0]:.1e} (zero), second smallest {eigval[1]:.3f}",
      abs(eigval[0]) < 1e-9 and eigval[1] > 1e-6)
fiedler = eigvec[:, 1]
if fiedler[np.argmin(X[:, 1])] > 0:
    fiedler = -fiedler                        # cold days on the negative side
rank = np.argsort(fiedler)
sweep = []
for n_first in range(1, m):
    mask = np.zeros(m, dtype=bool)
    mask[rank[:n_first]] = True
    sweep.append((n_first, cut(mask), ratio_cut(mask)))
sweep = np.array(sweep)
j_best = int(np.argmin(sweep[:, 2]))
mask_sweep = np.zeros(m, dtype=bool)
mask_sweep[rank[: int(sweep[j_best, 0])]] = True
check(f"[B-spectral] the best of the {m - 1} sweep cuts puts the "
      f"{int(sweep[j_best, 0])} most negative entries on one side; it is the "
      f"exact minimizer of the ratio cut", np.array_equal(mask_sweep, cold))
mask_sign = fiedler < 0
check("[B-spectral] the sign cut (negative entries versus positive) is the "
      "same partition", np.array_equal(mask_sign, cold))
check(f"[B-spectral] the ratio cut along the order rises to "
      f"{sweep[:, 2].max():.2f} for a cut through a cluster and is "
      f"{sweep[0, 2]:.2f} and {sweep[-1, 2]:.2f} for the two single-day cuts",
      sweep[:, 2].max() > 20 * rc_opt and min(sweep[0, 2], sweep[-1, 2]) > 10 * rc_opt)
[B-spectral] spectral clustering: sweep cuts along the Fiedler vector
  [ok] [B-spectral] eigenvalues of the Laplacian matrix: smallest 7.3e-16 (zero), second smallest 0.052
  [ok] [B-spectral] the best of the 20 sweep cuts puts the 11 most negative entries on one side; it is the exact minimizer of the ratio cut
  [ok] [B-spectral] the sign cut (negative entries versus positive) is the same partition
  [ok] [B-spectral] the ratio cut along the order rises to 2.81 for a cut through a cluster and is 1.21 and 1.36 for the two single-day cuts
CSVs for the figure (nodes, edges inside the clusters, cut edges, the 20 sweep cuts) and the preview.
print("[B-plot] nodes, edges, sweep cuts")
with open(OUT_DIR / "graphclustering_nodes_plot.csv", "w") as fh:
    fh.write("tmin,tmax,cluster,fiedler\n")
    for i in range(m):
        fh.write(f"{X[i, 0]:.1f},{X[i, 1]:.1f},{int(warm[i])},"
                 f"{fiedler[i]:.4f}\n")
for name, sel in (("within", [e for e in edges if e not in cut_edges]),
                  ("cut", cut_edges)):
    with open(OUT_DIR / f"graphclustering_edges_{name}.csv", "w") as fh:
        fh.write("x,y,u,v,weight\n")
        for i, j in sel:
            fh.write(f"{X[i, 0]:.1f},{X[i, 1]:.1f},{X[j, 0] - X[i, 0]:.1f},"
                     f"{X[j, 1] - X[i, 1]:.1f},{A[i, j]:.4f}\n")
with open(OUT_DIR / "graphclustering_sweep.csv", "w") as fh:
    fh.write("nfirst,cut,ratiocut\n")
    for n_first, c, rc in sweep:
        fh.write(f"{int(n_first)},{c:.4f},{rc:.4f}\n")
with open(OUT_DIR / "graphclustering_random.csv", "w") as fh:
    fh.write("nfirst,cut,ratiocut\n")          # the random partition, as a line
    for n_first in (1, m - 1):
        fh.write(f"{n_first},{cut_rand:.4f},{rc_rand:.4f}\n")
check(f"[B-plot] {m} nodes, {len(edges) - len(cut_edges)} edges inside the "
      f"clusters, {len(cut_edges)} cut edges, {m - 1} sweep cuts written",
      len(sweep) == m - 1)

fig, (ax1, ax2) = plt.subplots(1, 2, figsize=(9.4, 3.9))
for i, j in edges:
    if cold[i] != cold[j]:
        ax1.plot(X[[i, j], 0], X[[i, j], 1], color="black", lw=1.2, ls="--")
    else:
        ax1.plot(X[[i, j], 0], X[[i, j], 1], color="0.6", lw=0.8)
ax1.scatter(X[cold, 0], X[cold, 1], marker="o", facecolors="white",
            edgecolors="black", s=30, zorder=3, label="cold days (circles)")
ax1.scatter(X[warm, 0], X[warm, 1], marker="s", facecolors="white",
            edgecolors="black", s=30, zorder=3, label="warm days (squares)")
ax1.plot([], [], color="0.6", lw=0.8, label="edge inside a cluster")
ax1.plot([], [], color="black", lw=1.2, ls="--", label="cut edge")
ax1.set_xlabel("morning minimum temperature (°C)")
ax1.set_ylabel("maximum daytime temperature (°C)")
ax1.set_title("similarity graph over 21 days and its best ratio cut")
ax1.legend(frameon=False, fontsize=8)
ax2.plot(sweep[:, 0], sweep[:, 2], "ko-", ms=3, label="sweep cuts")
ax2.axhline(rc_rand, color="black", ls="--", lw=0.8,
            label="random partition")
ax2.set_xlabel("number of days on the negative side of the Fiedler vector")
ax2.set_ylabel("ratio cut")
ax2.set_title("ratio cut of the 20 cuts along the Fiedler order")
ax2.legend(frameon=False, fontsize=8)
fig.tight_layout()
fig.savefig(OUT_DIR / "graphclustering.png", dpi=110)

n_ok = sum(ok for _, ok in report)
print(f"\n{n_ok}/{len(report)} checks pass")
if n_ok != len(report):
    raise SystemExit(1)
[B-plot] nodes, edges, sweep cuts
  [ok] [B-plot] 21 nodes, 79 edges inside the clusters, 1 cut edges, 20 sweep cuts written

23/23 checks pass
B-plot writes when the script runs