B-plot writes when the script runsDictionary of Applied Machine Learning · degree of belonging
Updated on 2026-11-19
Numerical companion to the entry degree of belonging: it recomputes what the entry states and prints one line per check
Numerical companion to the glossary entry 'dob'. The 366 days of 2024 at Krems are data points with the feature vector (morning minimum temperature, maximum daytime temperature). A soft clustering assigns each day a degree of belonging to every cluster; a hard clustering is the special case where each day belongs to exactly one cluster.
Run it without installing anything:uv run https://dictionaryofml.org/terms/dob.py
uv downloads this script and the pinned NumPy and Matplotlib it needs, then runs it; the script fetches any input file it uses. To keep the output files, download dob.py into a folder and run uv run dob.py there. With NumPy and Matplotlib already installed, python3 dob.py, from any directory — it writes its output files into the current directory. Fixed seeds, so the printed numbers reproduce exactly. Download dob.py · Notebook · Open in Colab
Before running a downloaded copy, scan it: uvx bandit -q -t B102,B307,B602,B605 dob.py (B102,B307,B602,B605 are the exec, eval and shell checks of bandit) reports nothing: the script runs no shell command and evaluates no generated code.
One cell per block of the script: the code, and what that code printed when it last ran here
"""The degree of belonging of each day of one year at Krems an der Donau
to a cold cluster and to a warm cluster.

Purpose
-------
Numerical companion to the glossary entry 'dob'.  The 366 days of 2024 at
Krems are data points with the feature vector (morning minimum
temperature, maximum daytime temperature).  A soft clustering assigns
each day a degree of belonging to every cluster; a hard clustering is the
special case where each day belongs to exactly one cluster.

The demo checks the entry's claims: the two degrees of belonging of a
day are nonnegative and sum to one, so the vector of degrees of
belonging lies in the probability simplex; the posterior probability of
the cluster index under a two-component Gaussian mixture model (GMM) is
such a vector; the hard clustering delivered by k-means is the special
case where the vector is a vertex of the simplex, with one entry equal to
one and the other equal to zero; the mean of a GMM component is the
average of the feature vectors weighted by the degrees of belonging, and
the cluster probability is their average, so that with hard assignments
the weighted average is the mean of the assigned days; and under a common
covariance matrix sigma^2 I with equal cluster probabilities the degrees
of belonging turn into zero or one as sigma^2 shrinks.

Deterministic: EM starts from the k-means solution, which Lloyd's
algorithm reaches from the means of the colder and the warmer half of the
days.  Self-contained: numpy + matplotlib only; the GeoSphere download
falls back to the committed CSV.

Blocks
------
[B-data]      Download the daily minimum and maximum temperature of 2024
              at Krems (GeoSphere station 3805) or read the committed
              copy; 366 days, no missing value.
[B-hard]      k-means with k = 2 by Lloyd's algorithm: the degrees of
              belonging of a day are 0 or 1 and sum to one, a vertex of
              the probability simplex; the cold and the warm cluster.
[B-gmm]       EM for a two-component GMM: the degrees of belonging are the
              posterior probabilities of the cluster index, lie in [0, 1]
              and sum to one; the number of days whose larger degree of
              belonging is below 0.8, by month; the most ambiguous day.
[B-centroid]  The GMM mean is the average of the days weighted by their
              degrees of belonging and the cluster probability is their
              average; with the 0/1 degrees of k-means the weighted
              average is the mean of the assigned days.
[B-limit]     Equal cluster probabilities, covariance sigma^2 I and the
              k-means centroids as means: the share of days with a degree
              of belonging between 0.2 and 0.8 for several sigma^2, and
              the agreement with the k-means assignment as sigma^2 -> 0.
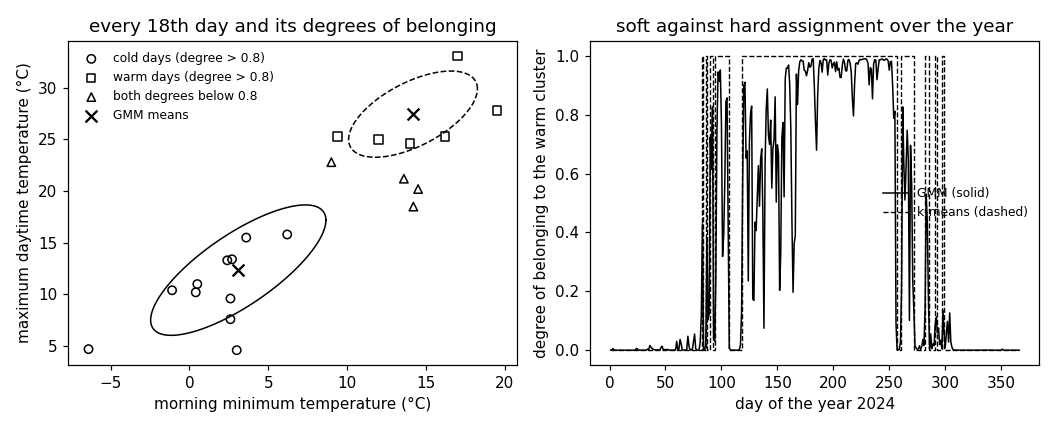
[B-plot]      Every 18th day for the figure (21 of 366 days) with its
              degrees of belonging, the two GMM means and one-standard-
              deviation ellipses, and the degree of belonging to the warm
              cluster of every day of the year.

Outputs
-------
dob_weather.csv      : date, tmin, tmax (committed copy).
dob_points_plot.csv  : the 21 drawn days with their degrees of belonging.
dob_means.csv        : the two GMM means and the two k-means centroids.
dob_ellipse1.csv, dob_ellipse2.csv : one-standard-deviation contours.
dob_year.csv         : day of the year, degree of belonging to the warm
                       cluster under the GMM, and the k-means assignment.
dob.png              : matplotlib preview (checking only).
"""

# /// script
# requires-python = ">=3.10"
# dependencies = ["matplotlib==3.10.7", "numpy==2.3.4"]
# ///

import json
import urllib.request
from pathlib import Path

import numpy as np
import matplotlib

matplotlib.use("Agg")
import matplotlib.pyplot as plt

OUT_DIR = Path(__file__).parent

report = []


def check(name, ok):
    report.append((name, bool(ok)))
    print(f"  [{'ok' if ok else 'FAIL'}] {name}")
Download the daily minimum and maximum temperature of 2024 at Krems (GeoSphere station 3805) or read the committed copy; 366 days, no missing value.
print("[B-data] daily minimum and maximum temperature at Krems, 2024")
URL = ("https://dataset.api.hub.geosphere.at/v1/station/historical/"
       "klima-v2-1d?parameters=tlmin,tlmax&station_ids=3805"
       "&start=2024-01-01&end=2024-12-31")
CSV = OUT_DIR / "dob_weather.csv"
try:
    with urllib.request.urlopen(URL, timeout=120) as resp:
        payload = json.load(resp)
    params = payload["features"][0]["properties"]["parameters"]
    records = [(stamp[:10], lo, hi)
               for stamp, lo, hi in zip(payload["timestamps"],
                                        params["tlmin"]["data"],
                                        params["tlmax"]["data"])]
    with open(CSV, "w") as fh:
        fh.write("date,tmin,tmax\n")
        for day, lo, hi in records:
            fh.write(f"{day},{lo},{hi}\n")
    print(f"    downloaded {len(records)} days")
except OSError as err:
    print(f"    download failed ({err}); reading the committed CSV")
    rows = CSV.read_text().strip().splitlines()[1:]
    records = [(d, float(a), float(b))
               for d, a, b in (r.split(",") for r in rows)]

check("[B-data] 366 days for 2024", len(records) == 366)
check("[B-data] no day is missing a temperature",
      all(lo is not None and hi is not None for _, lo, hi in records))
X = np.array([[lo, hi] for _, lo, hi in records], dtype=float)
m, d = X.shape
k = 2
months = np.array([int(day[5:7]) for day, _, _ in records])
MONTH = ["Jan", "Feb", "Mar", "Apr", "May", "Jun", "Jul", "Aug", "Sep",
         "Oct", "Nov", "Dec"]


def sq_dist(X, W):
    """Squared Euclidean distance of every row of X to every row of W."""
    return ((X[:, None, :] - W[None, :, :]) ** 2).sum(axis=2)


def one_hot(labels):
    """The degree-of-belonging vectors of a hard clustering: one entry 1."""
    U = np.zeros((len(labels), k))
    U[np.arange(len(labels)), labels] = 1.0
    return U


def in_simplex(U, tol=1e-9):
    return bool(np.all(U >= -tol) and np.allclose(U.sum(axis=1), 1.0,
                                                  atol=tol))
[B-data] daily minimum and maximum temperature at Krems, 2024
    downloaded 366 days
  [ok] [B-data] 366 days for 2024
  [ok] [B-data] no day is missing a temperature
k-means with k = 2 by Lloyd's algorithm: the degrees of belonging of a day are 0 or 1 and sum to one, a vertex of the probability simplex; the cold and the warm cluster.
print("[B-hard] k-means with k = 2: hard assignments")
order = np.argsort(X[:, 0])
W = np.array([X[order[: m // 2]].mean(axis=0),
              X[order[m // 2:]].mean(axis=0)])
labels = np.argmin(sq_dist(X, W), axis=1)
for _ in range(500):
    W = np.array([X[labels == j].mean(axis=0) for j in range(k)])
    new = np.argmin(sq_dist(X, W), axis=1)
    if np.array_equal(new, labels):
        break
    labels = new
# cluster 0 = cold (smaller maximum temperature), cluster 1 = warm
if W[0, 1] > W[1, 1]:
    W = W[::-1]
    labels = 1 - labels
U_hard = one_hot(labels)
check("[B-hard] every degree of belonging of k-means is 0 or 1",
      np.all(np.isin(U_hard, [0.0, 1.0])))
check("[B-hard] the two degrees of a day sum to one: a vertex of the "
      "probability simplex", in_simplex(U_hard)
      and np.all(U_hard.max(axis=1) == 1.0))
n_cold, n_warm = int((labels == 0).sum()), int((labels == 1).sum())
check(f"[B-hard] cold centroid ({W[0, 0]:.1f}, {W[0, 1]:.1f}) with "
      f"{n_cold} days, warm centroid ({W[1, 0]:.1f}, {W[1, 1]:.1f}) with "
      f"{n_warm} days", n_cold + n_warm == m and W[0, 1] < W[1, 1])
[B-hard] k-means with k = 2: hard assignments
  [ok] [B-hard] every degree of belonging of k-means is 0 or 1
  [ok] [B-hard] the two degrees of a day sum to one: a vertex of the probability simplex
  [ok] [B-hard] cold centroid (1.5, 10.5) with 192 days, warm centroid (13.4, 26.1) with 174 days
EM for a two-component GMM: the degrees of belonging are the posterior probabilities of the cluster index, lie in [0, 1] and sum to one; the number of days whose larger degree of belonging is below 0.8, by month; the most ambiguous day.
print("[B-gmm] EM for a two-component GMM, started from k-means")


def gauss_pdf(X, mu, S):
    diff = X - mu
    Sinv = np.linalg.inv(S)
    q = np.einsum("ij,jk,ik->i", diff, Sinv, diff)
    return np.exp(-0.5 * q) / (2 * np.pi * np.sqrt(np.linalg.det(S)))


def posterior(X, p, mus, Ss):
    """The degree of belonging as the posterior probability of the
    cluster index: Bayes' rule with the mixture density as denominator."""
    joint = np.stack([p[j] * gauss_pdf(X, mus[j], Ss[j]) for j in range(k)],
                     axis=1)
    return joint / joint.sum(axis=1, keepdims=True), joint


def neg_loglik(joint):
    return float(-np.mean(np.log(joint.sum(axis=1))))


p = np.array([n_cold, n_warm]) / m
mus = W.copy()
Ss = [np.cov(X[labels == j].T, bias=True) for j in range(k)]
nll = []
for it in range(500):
    U, joint = posterior(X, p, mus, Ss)                   # E-step
    nll.append(neg_loglik(joint))
    Nj = U.sum(axis=0)
    p = Nj / m                                           # M-step
    mus = (U.T @ X) / Nj[:, None]
    Ss = [((U[:, j, None] * (X - mus[j])).T @ (X - mus[j])) / Nj[j]
          for j in range(k)]
    if it > 1 and nll[-2] - nll[-1] < 1e-10:
        break
U, joint = posterior(X, p, mus, Ss)
if mus[0, 1] > mus[1, 1]:   # keep cluster 0 = cold
    p, mus, Ss, U = p[::-1], mus[::-1], Ss[::-1], U[:, ::-1]
check(f"[B-gmm] the negative log-likelihood never increases over "
      f"{len(nll) - 1} iterations ({nll[0]:.3f} -> {nll[-1]:.3f})",
      all(b <= a + 1e-9 for a, b in zip(nll, nll[1:])))
check("[B-gmm] every degree of belonging lies in [0, 1]",
      np.all((U >= 0) & (U <= 1)))
check("[B-gmm] the two degrees of a day sum to one: a vector of the "
      "probability simplex", in_simplex(U))
pdfs = np.stack([gauss_pdf(X, mus[j], Ss[j]) for j in range(k)], axis=1)
U_bayes = p * pdfs / (pdfs @ p)[:, None]
check("[B-gmm] the degree of belonging equals p_c N(x; mu_c, C_c) divided "
      "by the mixture density (Bayes' rule)", np.allclose(U, U_bayes))
check(f"[B-gmm] learned means ({mus[0, 0]:.1f}, {mus[0, 1]:.1f}) and "
      f"({mus[1, 0]:.1f}, {mus[1, 1]:.1f}), cluster probabilities "
      f"{p[0]:.2f} and {p[1]:.2f}", mus[0, 1] < mus[1, 1])
amb = U.max(axis=1) < 0.8
by_month = {MONTH[mo - 1]: int(np.sum(amb & (months == mo)))
            for mo in range(1, 13) if np.sum(amb & (months == mo)) > 0}
check(f"[B-gmm] {int(amb.sum())} of the {m} days have no degree of "
      f"belonging above 0.8: " + ", ".join(f"{v} in {mo}"
                                          for mo, v in by_month.items()),
      0 < amb.sum() < m / 4)
check("[B-gmm] no such day lies in November, December, January or "
      "February", not np.any(amb & np.isin(months, [11, 12, 1, 2])))
i_amb = int(np.argmin(np.abs(U[:, 1] - 0.5)))
date_amb = records[i_amb][0]
check(f"[B-gmm] the most ambiguous day is {date_amb} with temperatures "
      f"({X[i_amb, 0]:.1f}, {X[i_amb, 1]:.1f}) and degrees of belonging "
      f"({U[i_amb, 0]:.2f}, {U[i_amb, 1]:.2f})",
      abs(U[i_amb, 1] - 0.5) < 0.05)
gmm_hard = np.argmax(U, axis=1)
agree = float(np.mean(gmm_hard == labels))
check(f"[B-gmm] the larger degree of belonging names the k-means cluster "
      f"on {100 * agree:.1f}% of the days", agree > 0.9)
sure = ~amb
check(f"[B-gmm] a day with a degree of belonging above 0.8 is in the same "
      f"cluster as under k-means on {100 * np.mean(gmm_hard[sure] == labels[sure]):.1f}% "
      f"of these days", np.mean(gmm_hard[sure] == labels[sure]) > 0.95)
[B-gmm] EM for a two-component GMM, started from k-means
  [ok] [B-gmm] the negative log-likelihood never increases over 197 iterations (6.261 -> 6.247)
  [ok] [B-gmm] every degree of belonging lies in [0, 1]
  [ok] [B-gmm] the two degrees of a day sum to one: a vector of the probability simplex
  [ok] [B-gmm] the degree of belonging equals p_c N(x; mu_c, C_c) divided by the mixture density (Bayes' rule)
  [ok] [B-gmm] learned means (3.1, 12.3) and (14.2, 27.5), cluster probabilities 0.63 and 0.37
  [ok] [B-gmm] 58 of the 366 days have no degree of belonging above 0.8: 4 in Mar, 8 in Apr, 23 in May, 8 in Jun, 2 in Jul, 1 in Aug, 10 in Sep, 2 in Oct
  [ok] [B-gmm] no such day lies in November, December, January or February
  [ok] [B-gmm] the most ambiguous day is 2024-05-28 with temperatures (11.1, 21.3) and degrees of belonging (0.50, 0.50)
  [ok] [B-gmm] the larger degree of belonging names the k-means cluster on 91.5% of the days
  [ok] [B-gmm] a day with a degree of belonging above 0.8 is in the same cluster as under k-means on 96.1% of these days
The GMM mean is the average of the days weighted by their degrees of belonging and the cluster probability is their average; with the 0/1 degrees of k-means the weighted average is the mean of the assigned days.
print("[B-centroid] weighted means and cluster probabilities")
mu_w = (U.T @ X) / U.sum(axis=0)[:, None]
check("[B-centroid] each GMM mean is the average of the days weighted by "
      "their degrees of belonging", np.allclose(mu_w, mus, atol=1e-6))
check("[B-centroid] each cluster probability is the average degree of "
      "belonging over the days", np.allclose(U.mean(axis=0), p, atol=1e-6))
mu_hard = (U_hard.T @ X) / U_hard.sum(axis=0)[:, None]
check("[B-centroid] with the 0/1 degrees of k-means the same weighted "
      "average is the mean of the assigned days, the k-means centroid",
      np.allclose(mu_hard, W)
      and all(np.allclose(mu_hard[j], X[labels == j].mean(axis=0))
              for j in range(k)))
check(f"[B-centroid] the GMM means differ from the k-means centroids by "
      f"at most {np.abs(mus - W).max():.1f} degrees",
      np.abs(mus - W).max() < 5)
[B-centroid] weighted means and cluster probabilities
  [ok] [B-centroid] each GMM mean is the average of the days weighted by their degrees of belonging
  [ok] [B-centroid] each cluster probability is the average degree of belonging over the days
  [ok] [B-centroid] with the 0/1 degrees of k-means the same weighted average is the mean of the assigned days, the k-means centroid
  [ok] [B-centroid] the GMM means differ from the k-means centroids by at most 1.9 degrees
Equal cluster probabilities, covariance sigma^2 I and the k-means centroids as means: the share of days with a degree of belonging between 0.2 and 0.8 for several sigma^2, and the agreement with the k-means assignment as sigma^2 -> 0.
print("[B-limit] equal probabilities, covariance sigma^2 I, k-means means")
SIGMA2 = [1.0, 50.0, 1000.0]
share = {}
for s2 in SIGMA2:
    logit = (sq_dist(X, W)[:, 0] - sq_dist(X, W)[:, 1]) / (2 * s2)
    u_warm = 1.0 / (1.0 + np.exp(-logit))
    U_s = np.stack([1 - u_warm, u_warm], axis=1)
    share[s2] = (float(np.mean((U_s.min(axis=1) > 0.2))),
                 float(np.mean(np.argmax(U_s, axis=1) == labels)),
                 float(np.abs(U_s - U_hard).max()))
check("[B-limit] share of days with both degrees above 0.2: "
      + ", ".join(f"sigma^2 = {s2:g}: {100 * v[0]:.0f}%"
                  for s2, v in share.items()),
      share[SIGMA2[0]][0] < share[SIGMA2[1]][0] < share[SIGMA2[2]][0])
check(f"[B-limit] sigma^2 = {SIGMA2[0]:g}: every degree of belonging is "
      f"within {share[SIGMA2[0]][2]:.2f} of the 0/1 value of k-means",
      share[SIGMA2[0]][2] < 0.05)
check("[B-limit] the larger degree names the k-means cluster for every "
      "sigma^2", all(v[1] == 1.0 for v in share.values()))
check(f"[B-limit] sigma^2 = {SIGMA2[2]:g}: no degree of belonging is "
      f"above {np.max(1 / (1 + np.exp(-np.abs((sq_dist(X, W)[:, 0] - sq_dist(X, W)[:, 1]) / (2 * SIGMA2[2]))))):.2f}",
      share[SIGMA2[2]][0] > 0.9)
[B-limit] equal probabilities, covariance sigma^2 I, k-means means
  [ok] [B-limit] share of days with both degrees above 0.2: sigma^2 = 1: 0%, sigma^2 = 50: 16%, sigma^2 = 1000: 100%
  [ok] [B-limit] sigma^2 = 1: every degree of belonging is within 0.01 of the 0/1 value of k-means
  [ok] [B-limit] the larger degree names the k-means cluster for every sigma^2
  [ok] [B-limit] sigma^2 = 1000: no degree of belonging is above 0.63
Every 18th day for the figure (21 of 366 days) with its degrees of belonging, the two GMM means and one-standard- deviation ellipses, and the degree of belonging to the warm cluster of every day of the year.
print("[B-plot] thinned scatter, means, ellipses, degree over the year")
idx = np.arange(0, m, 18)
cls = np.where(U[:, 0] > 0.8, 0, np.where(U[:, 1] > 0.8, 1, 2))
with open(OUT_DIR / "dob_points_plot.csv", "w") as fh:
    fh.write("tmin,tmax,ucold,uwarm,class\n")
    for i in idx:
        fh.write(f"{X[i, 0]:.1f},{X[i, 1]:.1f},{U[i, 0]:.3f},{U[i, 1]:.3f},"
                 f"{cls[i]}\n")
check(f"[B-plot] every 18th day: {len(idx)} of the {m} days are drawn, "
      f"{int(np.sum(cls[idx] == 2))} of them with both degrees below 0.8",
      len(idx) == 21 and np.sum(cls[idx] == 2) >= 1)
with open(OUT_DIR / "dob_means.csv", "w") as fh:
    fh.write("kindid,kind,cluster,tmin,tmax\n")
    for j in range(k):
        fh.write(f"0,gmm,{j},{mus[j, 0]:.4f},{mus[j, 1]:.4f}\n")
    for j in range(k):
        fh.write(f"1,kmeans,{j},{W[j, 0]:.4f},{W[j, 1]:.4f}\n")
t = np.linspace(0, 2 * np.pi, 121)
for j in range(k):
    Lc = np.linalg.cholesky(Ss[j])
    E = mus[j] + (Lc @ np.stack([np.cos(t), np.sin(t)])).T
    with open(OUT_DIR / f"dob_ellipse{j + 1}.csv", "w") as fh:
        fh.write("x1,x2\n")
        for a, b in E:
            fh.write(f"{a:.4f},{b:.4f}\n")
with open(OUT_DIR / "dob_year.csv", "w") as fh:
    fh.write("day,date,uwarm,hard\n")
    for i in range(m):
        fh.write(f"{i + 1},{records[i][0]},{U[i, 1]:.4f},{labels[i]}\n")

fig, (ax1, ax2) = plt.subplots(1, 2, figsize=(9.6, 3.9))
for c, mk, lab in ((0, "o", "cold days (degree > 0.8)"),
                   (1, "s", "warm days (degree > 0.8)"),
                   (2, "^", "both degrees below 0.8")):
    sel = idx[cls[idx] == c]
    ax1.scatter(X[sel, 0], X[sel, 1], marker=mk, facecolors="none",
                edgecolors="black", s=30, label=lab)
for j, ls in ((0, "-"), (1, "--")):
    Lc = np.linalg.cholesky(Ss[j])
    E = mus[j] + (Lc @ np.stack([np.cos(t), np.sin(t)])).T
    ax1.plot(E[:, 0], E[:, 1], color="black", ls=ls, lw=1.0)
ax1.scatter(mus[:, 0], mus[:, 1], marker="x", color="black", s=60,
            label="GMM means")
ax1.set_xlabel("morning minimum temperature (°C)")
ax1.set_ylabel("maximum daytime temperature (°C)")
ax1.set_title("every 18th day and its degrees of belonging")
ax1.legend(frameon=False, fontsize=8)
ax2.plot(np.arange(1, m + 1), U[:, 1], color="black", lw=1.0,
         label="GMM (solid)")
ax2.step(np.arange(1, m + 1), labels, color="black", ls="--", lw=0.9,
         where="mid", label="k-means (dashed)")
ax2.set_xlabel("day of the year 2024")
ax2.set_ylabel("degree of belonging to the warm cluster")
ax2.set_title("soft against hard assignment over the year")
ax2.legend(frameon=False, fontsize=8, loc="center right")
fig.tight_layout()
fig.savefig(OUT_DIR / "dob.png", dpi=110)

n_ok = sum(ok for _, ok in report)
print(f"\n{n_ok}/{len(report)} checks pass")
if n_ok != len(report):
    raise SystemExit(1)
[B-plot] thinned scatter, means, ellipses, degree over the year
  [ok] [B-plot] every 18th day: 21 of the 366 days are drawn, 4 of them with both degrees below 0.8

24/24 checks pass
B-plot writes when the script runs