B-plot writes when the script runsDictionary of Applied Machine Learning · decoder
Updated on 2026-11-20
Numerical companion to the entry decoder: it recomputes what the entry states and prints one line per check
Numerical companion to the glossary entry 'decoder'. The GeoSphere Austria weather station Krems an der Donau (station id 3805) records eight measurements per day: lowest, highest and mean air temperature, precipitation, sunshine duration, relative humidity, air pressure and wind speed. The 366 days of 2024 are downloaded from the data hub (dataset klima-v2-1d) and each measurement is scaled to zero sample mean and unit sample variance, because temperatures, precipitation and pressure carry different units.
Run it without installing anything:uv run https://dictionaryofml.org/terms/decoder.py
uv downloads this script and the pinned NumPy and Matplotlib it needs, then runs it; the script fetches any input file it uses. To keep the output files, download decoder.py into a folder and run uv run decoder.py there. With NumPy and Matplotlib already installed, python3 decoder.py, from any directory — it writes its output files into the current directory. Fixed seeds, so the printed numbers reproduce exactly. Download decoder.py · Notebook · Open in Colab
Before running a downloaded copy, scan it: uvx bandit -q -t B102,B307,B602,B605 decoder.py (B102,B307,B602,B605 are the exec, eval and shell checks of bandit) reports nothing: the script runs no shell command and evaluates no generated code.
One cell per block of the script: the code, and what that code printed when it last ran here
"""The decoder of a code: for the linear decoder of principal component
analysis the reconstruction is an orthogonal projection and the average
squared reconstruction error is the sum of the discarded eigenvalues.

Purpose
-------
Numerical companion to the glossary entry 'decoder'.  The GeoSphere
Austria weather station Krems an der Donau (station id 3805) records
eight measurements per day: lowest, highest and mean air temperature,
precipitation, sunshine duration, relative humidity, air pressure and
wind speed.  The 366 days of 2024 are downloaded from the data hub
(dataset klima-v2-1d) and each measurement is scaled to zero sample mean
and unit sample variance, because temperatures, precipitation and
pressure carry different units.

The script recomputes what the entry claims about a decoder.  (1) For a
linear encoder with orthonormal rows, the decoder that leaves the
smallest average squared reconstruction error is the transpose of the
encoder.  (2) The reconstruction map is then an orthogonal projection:
idempotent, symmetric, the reconstruction lies in the span of the
retained eigenvectors and the error it leaves is orthogonal to that
span.  (3) The average squared reconstruction error equals the sum of
the discarded eigenvalues, for every code length.  (4) A probabilistic
decoder that returns a Gaussian conditional distribution with a fixed
spread has the same best linear map, because its log-likelihood is a
decreasing affine function of the same reconstruction error.  (5) A
decoder onto a distribution over a vocabulary: a linear map followed by
the softmax function sends a context vector to a point of the
probability simplex, the parameters that maximize the log-likelihood
reproduce the observed next-token frequencies, and a sequence is
generated one token at a time.  (6) What the flat reconstruction set of a
linear decoder costs: read back in the recorded units it holds values no
weather record takes, a decoder free to curve does not beat the line on
this record, and the eight-token vocabulary resolves the maximum daytime
temperature of a day only to its bin.

Deterministic: a fixed archive year, an eigenvalue decomposition, and
fixed seeds for the random comparison maps and the generated sequence.
Self-contained: numpy and matplotlib only (stdlib urllib for the
download, which falls back to the committed CSV).

Blocks
------
[B-data]        The 366 days with eight measurements each; the two
                temperatures centered for the picture, all eight scaled
                for the identities.
[B-transpose]   For a decoder with orthonormal columns the best encoder
                is its transpose, and for the PCA encoder the best
                decoder is its transpose; a generic encoder does not
                have this property.
[B-projection]  The reconstruction map of the PCA pair is an orthogonal
                projection onto the span of the retained eigenvectors.
[B-eigenvalues] The average squared reconstruction error equals the sum
                of the discarded eigenvalues, for every code length.
[B-gauss]       A Gaussian probabilistic decoder: its log-likelihood is
                a decreasing affine function of the reconstruction
                error, so both are minimized by the same decoder.
[B-vocabulary]  A decoder onto a distribution over eight temperature
                tokens: a linear map and the softmax function land in
                the probability simplex, the maximum-likelihood
                parameters reproduce the observed next-token
                frequencies, and a sequence is generated one token at a
                time.
[B-limits]      What the flat reconstruction set costs: in the recorded
                units it holds values no day of the record takes, a
                decoder free to curve does not beat the line on the days
                it was not learned from, and the eight tokens resolve a
                day only to its bin.
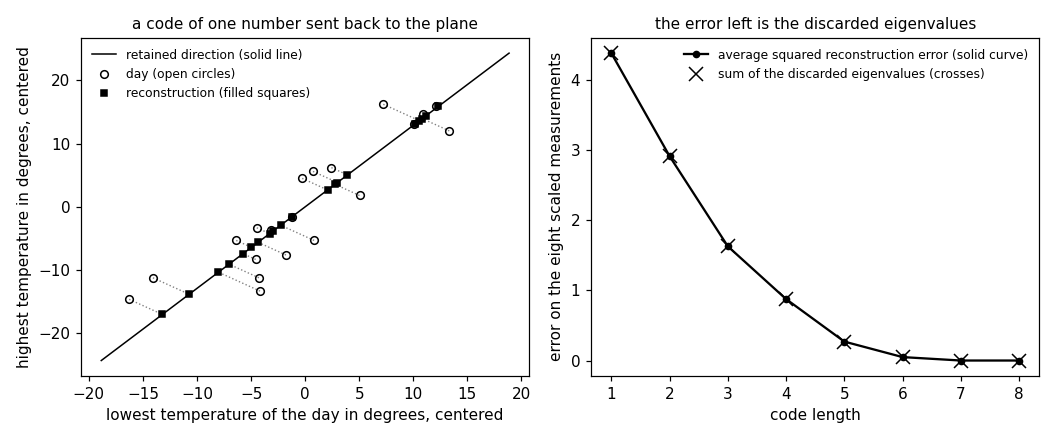
[B-plot]        The CSVs the figure reads and the matplotlib preview: the
                days with their reconstructions from a code of one
                number, and the error against the code length.

Outputs
-------
decoder_weather.csv      : date and the eight measurements, 366 days
decoder_points_plot.csv  : the 20 days (every 19th) the figure draws,
                           with the reconstruction of each from a code
                           of one number
decoder_direction.csv    : the retained direction as a segment
decoder_errord.csv       : code length, average squared reconstruction
                           error, sum of the discarded eigenvalues
decoder.png              : matplotlib preview (checking only)
"""

# /// script
# requires-python = ">=3.10"
# dependencies = ["matplotlib==3.10.7", "numpy==2.3.4"]
# ///

import json
import urllib.request
from pathlib import Path

import numpy as np
import matplotlib

matplotlib.use("Agg")
import matplotlib.pyplot as plt

OUT_DIR = Path(__file__).parent

report = []


def check(name, ok):
    report.append((name, bool(ok)))
    print(f"  [{'ok' if ok else 'FAIL'}] {name}")
Installed 11 packages in 57ms
The 366 days with eight measurements each; the two temperatures centered for the picture, all eight scaled for the identities.
print("[B-data] eight measurements for each of the 366 days of 2024")
PARAMS = ["tlmin", "tlmax", "tl_mittel", "rr", "so_h", "rf_mittel",
          "p_mittel", "vv_mittel"]
URL = ("https://dataset.api.hub.geosphere.at/v1/station/historical/"
       f"klima-v2-1d?parameters={','.join(PARAMS)}&station_ids=3805"
       "&start=2024-01-01&end=2024-12-31")
CSV = OUT_DIR / "decoder_weather.csv"
try:
    with urllib.request.urlopen(URL, timeout=120) as resp:
        payload = json.load(resp)
    params = payload["features"][0]["properties"]["parameters"]
    stamps = [t[:10] for t in payload["timestamps"]]
    M = np.stack([np.array(params[p]["data"], dtype=float) for p in PARAMS], 1)
    M[:, 3] = np.maximum(M[:, 3], 0.0)          # -1 marks a trace of rain
    with open(CSV, "w") as fh:
        fh.write("date," + ",".join(PARAMS) + "\n")
        for day, row in zip(stamps, M):
            fh.write(day + "," + ",".join(f"{v:g}" for v in row) + "\n")
    print(f"    downloaded {len(stamps)} days")
except OSError as err:
    print(f"    download failed ({err}); reading the committed CSV")
    rows = CSV.read_text().strip().splitlines()[1:]
    stamps = [r.split(",")[0] for r in rows]
    M = np.array([[float(v) for v in r.split(",")[1:]] for r in rows])

T = M[:, :2] - M[:, :2].mean(axis=0)            # centered, in degrees
X = (M - M.mean(axis=0)) / M.std(axis=0)        # scaled, all eight
m, d = X.shape
check("[B-data] 366 days with eight measurements each", (m, d) == (366, 8))
check("[B-data] the record matches the archive (Feb 1: -3.8 to 10.4 deg)",
      stamps[31] == "2024-02-01" and np.allclose(M[31, :2], [-3.8, 10.4]))
check("[B-data] every measurement has zero sample mean and unit sample "
      "variance after scaling",
      np.allclose(X.mean(axis=0), 0) and np.allclose(X.std(axis=0), 1))


def principal(A):
    """Eigenvalues and eigenvectors of the sample covariance matrix of the
    centered rows of A, in decreasing order of eigenvalue."""
    Q = A.T @ A / len(A)
    vals, vecs = np.linalg.eigh(Q)
    order = np.argsort(vals)[::-1]
    return vals[order], vecs[:, order]


def avg_sq_error(R, W, A):
    """Average over the rows a of A of || a - R W a ||^2."""
    return float((((A - A @ W.T @ R.T) ** 2).sum(axis=1)).mean())


def best_decoder(W, A):
    """The decoder R that minimizes avg_sq_error(R, W, A), by least squares."""
    Z = A @ W.T
    return np.linalg.lstsq(Z, A, rcond=None)[0].T


lam, U = principal(X)
DPRIME = 2
W = U[:, :DPRIME].T                             # PCA encoder, DPRIME x d
[B-data] eight measurements for each of the 366 days of 2024
    downloaded 366 days
  [ok] [B-data] 366 days with eight measurements each
  [ok] [B-data] the record matches the archive (Feb 1: -3.8 to 10.4 deg)
  [ok] [B-data] every measurement has zero sample mean and unit sample variance after scaling
For a decoder with orthonormal columns the best encoder is its transpose, and for the PCA encoder the best decoder is its transpose; a generic encoder does not have this property.
print("[B-transpose] the best decoder for the PCA encoder is its transpose")
R_hat = best_decoder(W, X)
check(f"[B-transpose] the rows of the PCA encoder are orthonormal "
      f"({DPRIME} retained eigenvectors)", np.allclose(W @ W.T, np.eye(DPRIME)))
check("[B-transpose] the least-squares decoder for that encoder is its "
      "transpose", np.allclose(R_hat, W.T, atol=1e-10))
rng = np.random.default_rng(0)
generic = rng.standard_normal((DPRIME, d))
gap = np.abs(best_decoder(generic, X) - generic.T).max()
check(f"[B-transpose] a generic encoder has no such property: its "
      f"least-squares decoder differs from its transpose by up to "
      f"{gap:.2f} entrywise", gap > 0.1)
err_tp = avg_sq_error(W.T, W, X)
worse = [avg_sq_error(W.T + 0.05 * rng.standard_normal((d, DPRIME)), W, X)
         for _ in range(200)]
check(f"[B-transpose] the transpose leaves {err_tp:.3f}; no perturbed "
      f"decoder does better (best of 200: {min(worse):.3f})",
      err_tp <= min(worse))
[B-transpose] the best decoder for the PCA encoder is its transpose
  [ok] [B-transpose] the rows of the PCA encoder are orthonormal (2 retained eigenvectors)
  [ok] [B-transpose] the least-squares decoder for that encoder is its transpose
  [ok] [B-transpose] a generic encoder has no such property: its least-squares decoder differs from its transpose by up to 2.12 entrywise
  [ok] [B-transpose] the transpose leaves 2.912; no perturbed decoder does better (best of 200: 2.946)
The reconstruction map of the PCA pair is an orthogonal projection onto the span of the retained eigenvectors.
print("[B-projection] the reconstruction is an orthogonal projection")
P = W.T @ W
check("[B-projection] the reconstruction map is idempotent and symmetric",
      np.allclose(P @ P, P) and np.allclose(P, P.T))
recon = X @ P.T
resid = X - recon
check("[B-projection] the reconstruction of every day lies in the span of "
      "the retained eigenvectors",
      np.allclose(recon @ U[:, DPRIME:], 0, atol=1e-10))
check("[B-projection] the error the decoder leaves is orthogonal to that "
      "span", np.allclose(resid @ U[:, :DPRIME], 0, atol=1e-10))
pyth = np.allclose((X ** 2).sum(axis=1),
                   (recon ** 2).sum(axis=1) + (resid ** 2).sum(axis=1))
check("[B-projection] squared lengths add: reconstruction plus error",
      pyth)
[B-projection] the reconstruction is an orthogonal projection
  [ok] [B-projection] the reconstruction map is idempotent and symmetric
  [ok] [B-projection] the reconstruction of every day lies in the span of the retained eigenvectors
  [ok] [B-projection] the error the decoder leaves is orthogonal to that span
  [ok] [B-projection] squared lengths add: reconstruction plus error
The average squared reconstruction error equals the sum of the discarded eigenvalues, for every code length.
print("[B-eigenvalues] the error is the sum of the discarded eigenvalues")
errs, drops = [], []
for dp in range(1, d + 1):
    Wd = U[:, :dp].T
    errs.append(avg_sq_error(Wd.T, Wd, X))
    drops.append(float(lam[dp:].sum()))
errs, drops = np.array(errs), np.array(drops)
check("[B-eigenvalues] for every code length the average squared "
      "reconstruction error equals the sum of the discarded eigenvalues",
      np.allclose(errs, drops))
print("    code length : error : sum of discarded eigenvalues")
for dp in range(1, d + 1):
    print(f"    {dp:11d} : {errs[dp - 1]:.4f} : {drops[dp - 1]:.4f}")
check(f"[B-eigenvalues] a code of two numbers leaves {errs[1]:.2f} of the "
      f"total {d:d}, so the two retained eigenvalues carry "
      f"{100 * (1 - errs[1] / d):.0f} percent of the total sample variance",
      abs(errs[1] - drops[1]) < 1e-9)
check(f"[B-eigenvalues] the error falls with the code length and vanishes "
      f"at {d:d}, where nothing is compressed",
      np.all(np.diff(errs) < 0) and abs(errs[-1]) < 1e-9)
lam2, U2 = principal(T)
err1_T = avg_sq_error(U2[:, :1], U2[:, :1].T, T)
check(f"[B-eigenvalues] on the two temperatures in degrees, a code of one "
      f"number leaves {err1_T:.2f} squared degrees, the discarded "
      f"eigenvalue {lam2[1]:.2f}", np.isclose(err1_T, lam2[1]))
[B-eigenvalues] the error is the sum of the discarded eigenvalues
  [ok] [B-eigenvalues] for every code length the average squared reconstruction error equals the sum of the discarded eigenvalues
    code length : error : sum of discarded eigenvalues
              1 : 4.3789 : 4.3789
              2 : 2.9116 : 2.9116
              3 : 1.6267 : 1.6267
              4 : 0.8752 : 0.8752
              5 : 0.2695 : 0.2695
              6 : 0.0488 : 0.0488
              7 : 0.0000 : 0.0000
              8 : 0.0000 : 0.0000
  [ok] [B-eigenvalues] a code of two numbers leaves 2.91 of the total 8, so the two retained eigenvalues carry 64 percent of the total sample variance
  [ok] [B-eigenvalues] the error falls with the code length and vanishes at 8, where nothing is compressed
  [ok] [B-eigenvalues] on the two temperatures in degrees, a code of one number leaves 7.94 squared degrees, the discarded eigenvalue 7.94
A Gaussian probabilistic decoder: its log-likelihood is a decreasing affine function of the reconstruction error, so both are minimized by the same decoder.
print("[B-gauss] a Gaussian probabilistic decoder has the same best map")
SIGMA = 0.5
Z = X @ W.T


def loglik(R):
    """Average log-density of the days under the Gaussian decoder
    p(x | z) with mean R z and covariance SIGMA^2 times the identity."""
    sq = (((X - Z @ R.T) ** 2).sum(axis=1)).mean()
    return -0.5 * d * np.log(2 * np.pi * SIGMA ** 2) - sq / (2 * SIGMA ** 2)


cands = [W.T] + [W.T + 0.1 * rng.standard_normal((d, DPRIME))
                 for _ in range(300)]
lls = np.array([loglik(R) for R in cands])
sqs = np.array([avg_sq_error(R, W, X) for R in cands])
check("[B-gauss] the log-likelihood is a decreasing affine function of the "
      "reconstruction error",
      np.allclose(lls, lls[0] + (sqs[0] - sqs) / (2 * SIGMA ** 2)))
check(f"[B-gauss] the transpose maximizes the log-likelihood "
      f"({lls[0]:.3f} against a best of {lls[1:].max():.3f} among 300 "
      f"perturbations)", lls[0] >= lls.max() - 1e-12)
[B-gauss] a Gaussian probabilistic decoder has the same best map
  [ok] [B-gauss] the log-likelihood is a decreasing affine function of the reconstruction error
  [ok] [B-gauss] the transpose maximizes the log-likelihood (-7.630 against a best of -7.851 among 300 perturbations)
A decoder onto a distribution over eight temperature tokens: a linear map and the softmax function land in the probability simplex, the maximum-likelihood parameters reproduce the observed next-token frequencies, and a sequence is generated one token at a time.
print("[B-vocabulary] a decoder onto a distribution over eight tokens")
VSIZE = 8
edges = np.quantile(M[:, 1], np.arange(1, VSIZE) / VSIZE)
tokens = np.searchsorted(edges, M[:, 1])        # one token per day
check(f"[B-vocabulary] the maximum daytime temperature of each day is cut "
      f"into {VSIZE} tokens of about {m // VSIZE} days each",
      tokens.min() == 0 and tokens.max() == VSIZE - 1)
counts = np.zeros((VSIZE, VSIZE))
for a, b in zip(tokens[:-1], tokens[1:]):
    counts[a, b] += 1
context = np.eye(VSIZE)                         # context vector of a token


def softmax(S):
    E = np.exp(S - S.max(axis=1, keepdims=True))
    return E / E.sum(axis=1, keepdims=True)


# the decoder: context vector -> linear map -> softmax -> distribution
Theta = np.zeros((VSIZE, VSIZE))
lrate, steps = 1.0, 4000
for _ in range(steps):
    Pr = softmax(context @ Theta.T)
    Theta += lrate * (counts - counts.sum(axis=1, keepdims=True) * Pr).T / m
Pr = softmax(context @ Theta.T)
check("[B-vocabulary] every output of the decoder is a point of the "
      "probability simplex: nonnegative entries summing to one",
      np.all(Pr >= 0) and np.allclose(Pr.sum(axis=1), 1))
freq = counts / counts.sum(axis=1, keepdims=True)
check(f"[B-vocabulary] the maximum-likelihood parameters reproduce the "
      f"observed next-token frequencies (largest deviation "
      f"{np.abs(Pr - freq).max():.4f})", np.abs(Pr - freq).max() < 0.01)
gen_rng = np.random.default_rng(2024)
seq = [int(tokens[0])]
for _ in range(20000):                          # one token at a time
    p = Pr[seq[-1]]
    seq.append(int(gen_rng.choice(VSIZE, p=p)))
seq = np.array(seq)
share_gen = np.array([(seq == v).mean() for v in range(VSIZE)])
share_obs = np.array([(tokens == v).mean() for v in range(VSIZE)])
print("    generated share : observed share, per token")
for v in range(VSIZE):
    print(f"    {share_gen[v]:.3f} : {share_obs[v]:.3f}")
check(f"[B-vocabulary] a sequence of {len(seq)} tokens generated one token "
      f"at a time matches the observed token shares to within "
      f"{np.abs(share_gen - share_obs).max():.3f}",
      np.abs(share_gen - share_obs).max() < 0.03)
greedy = int(np.argmax(Pr[0]))
check(f"[B-vocabulary] after the coldest token the decoder puts the most "
      f"probability, {Pr[0, greedy]:.2f}, on token {greedy}", greedy <= 1)
[B-vocabulary] a decoder onto a distribution over eight tokens
  [ok] [B-vocabulary] the maximum daytime temperature of each day is cut into 8 tokens of about 45 days each
  [ok] [B-vocabulary] every output of the decoder is a point of the probability simplex: nonnegative entries summing to one
  [ok] [B-vocabulary] the maximum-likelihood parameters reproduce the observed next-token frequencies (largest deviation 0.0014)
    generated share : observed share, per token
    0.129 : 0.128
    0.118 : 0.126
    0.114 : 0.123
    0.124 : 0.126
    0.129 : 0.123
    0.124 : 0.123
    0.132 : 0.126
    0.129 : 0.126
  [ok] [B-vocabulary] a sequence of 20001 tokens generated one token at a time matches the observed token shares to within 0.009
  [ok] [B-vocabulary] after the coldest token the decoder puts the most probability, 0.69, on token 0
What the flat reconstruction set costs: in the recorded units it holds values no day of the record takes, a decoder free to curve does not beat the line on the days it was not learned from, and the eight tokens resolve a day only to its bin.
print("[B-limits] the reconstructions of a linear decoder lie in a subspace")
units = X @ P.T * M.std(axis=0) + M.mean(axis=0)   # back in the recorded units
rain, sun, hum = units[:, 3], units[:, 4], units[:, 5]
check("[B-limits] no day of the record has a negative precipitation, a "
      "negative sunshine duration or a humidity above 100 percent",
      M[:, 3].min() >= 0 and M[:, 4].min() >= 0 and M[:, 5].max() <= 100)
check(f"[B-limits] a code of {DPRIME} numbers gives {(rain < 0).sum():d} of "
      f"the {m:d} days a negative precipitation, down to {rain.min():.1f} "
      f"millimeters", (rain < 0).sum() > 0)
check(f"[B-limits] it gives {(sun < 0).sum():d} days a negative sunshine "
      f"duration, down to {sun.min():.1f} hours, and {(hum > 100).sum():d} "
      f"days a humidity above 100 percent, up to {hum.max():.0f}",
      (sun < 0).sum() > 0 and (hum > 100).sum() > 0)
even = np.arange(m) % 2 == 0
z1 = X @ U[:, 0]
NBINS = 8
cuts = np.quantile(z1[even], np.arange(1, NBINS) / NBINS)
b_in, b_out = np.searchsorted(cuts, z1[even]), np.searchsorted(cuts, z1[~even])
curve = np.array([X[even][b_in == b].mean(axis=0) for b in range(NBINS)])
err_curve = float((((X[~even] - curve[b_out]) ** 2).sum(axis=1)).mean())
err_line = float((((X[~even] - np.outer(z1[~even], U[:, 0])) ** 2).sum(axis=1))
                 .mean())
check(f"[B-limits] with the same code of one number, the average of the days "
      f"in each of {NBINS} bins of the code leaves {err_curve:.2f} on the days "
      f"it was not learned from, against the linear decoder's {err_line:.2f}",
      err_curve > err_line)
mid = np.array([M[tokens == v, 1].mean() for v in range(VSIZE)])
rmse_tok = float(np.sqrt(((M[:, 1] - mid[tokens]) ** 2).mean()))
widths = [float(np.ptp(M[tokens == v, 1])) for v in range(VSIZE)]
check(f"[B-limits] the {VSIZE} tokens resolve the maximum daytime temperature "
      f"of a day only to its bin: {rmse_tok:.1f} degrees in root mean square, "
      f"and {max(widths):.1f} degrees for the coldest token, which holds every "
      f"day at or below {edges[0]:.1f} degrees",
      max(widths) == widths[0] and rmse_tok > 1)
[B-limits] the reconstructions of a linear decoder lie in a subspace
  [ok] [B-limits] no day of the record has a negative precipitation, a negative sunshine duration or a humidity above 100 percent
  [ok] [B-limits] a code of 2 numbers gives 128 of the 366 days a negative precipitation, down to -7.3 millimeters
  [ok] [B-limits] it gives 17 days a negative sunshine duration, down to -10.8 hours, and 2 days a humidity above 100 percent, up to 121
  [ok] [B-limits] with the same code of one number, the average of the days in each of 8 bins of the code leaves 5.10 on the days it was not learned from, against the linear decoder's 5.07
  [ok] [B-limits] the 8 tokens resolve the maximum daytime temperature of a day only to its bin: 1.4 degrees in root mean square, and 10.3 degrees for the coldest token, which holds every day at or below 6.7 degrees
The CSVs the figure reads and the matplotlib preview: the days with their reconstructions from a code of one number, and the error against the code length.
print("[B-plot] CSVs for the figure and the matplotlib preview")
STEP = 19
sel = np.arange(0, m, STEP)[:20]
u1 = U2[:, 0] * np.sign(U2[0, 0])
rec_T = np.outer(T @ u1, u1)
with open(OUT_DIR / "decoder_points_plot.csv", "w") as fh:
    fh.write("x1,x2,r1,r2\n")
    for i in sel:
        fh.write(f"{T[i, 0]:.4f},{T[i, 1]:.4f},"
                 f"{rec_T[i, 0]:.4f},{rec_T[i, 1]:.4f}\n")
span = 1.15 * np.abs(T @ u1).max()
with open(OUT_DIR / "decoder_direction.csv", "w") as fh:
    fh.write("x1,x2\n")
    for s in (-span, span):
        fh.write(f"{s * u1[0]:.4f},{s * u1[1]:.4f}\n")
with open(OUT_DIR / "decoder_errord.csv", "w") as fh:
    fh.write("dprime,err,dropped\n")
    for dp in range(1, d + 1):
        fh.write(f"{dp},{errs[dp - 1]:.4f},{drops[dp - 1]:.4f}\n")
check(f"[B-plot] the figure draws {len(sel)} of the {m} days, every "
      f"{STEP}th", len(sel) == 20)

fig, (ax1, ax2) = plt.subplots(1, 2, figsize=(9.6, 4.0))
ax1.plot([-span * u1[0], span * u1[0]], [-span * u1[1], span * u1[1]],
         color="black", ls="-", lw=1.0, label="retained direction (solid line)")
for i in sel:
    ax1.plot([T[i, 0], rec_T[i, 0]], [T[i, 1], rec_T[i, 1]],
             color="gray", ls=":", lw=0.9)
ax1.plot(T[sel, 0], T[sel, 1], ls="none", marker="o", mfc="none",
         color="black", ms=5, label="day (open circles)")
ax1.plot(rec_T[sel, 0], rec_T[sel, 1], ls="none", marker="s", color="black",
         ms=4, label="reconstruction (filled squares)")
ax1.set_xlabel("lowest temperature of the day in degrees, centered")
ax1.set_ylabel("highest temperature in degrees, centered")
ax1.set_title("a code of one number sent back to the plane", fontsize=10)
ax1.legend(frameon=False, fontsize=8)
ax2.plot(np.arange(1, d + 1), errs, color="black", ls="-", marker="o", ms=4,
         label="average squared reconstruction error (solid curve)")
ax2.plot(np.arange(1, d + 1), drops, color="black", ls="none", marker="x",
         ms=9, label="sum of the discarded eigenvalues (crosses)")
ax2.set_xlabel("code length")
ax2.set_ylabel("error on the eight scaled measurements")
ax2.set_title("the error left is the discarded eigenvalues", fontsize=10)
ax2.legend(frameon=False, fontsize=8)
fig.tight_layout()
fig.savefig(OUT_DIR / "decoder.png", dpi=110)

n_ok = sum(ok for _, ok in report)
print(f"\n{n_ok}/{len(report)} checks pass")
if n_ok != len(report):
    raise SystemExit(1)
[B-plot] CSVs for the figure and the matplotlib preview
  [ok] [B-plot] the figure draws 20 of the 366 days, every 19th

28/28 checks pass
B-plot writes when the script runs