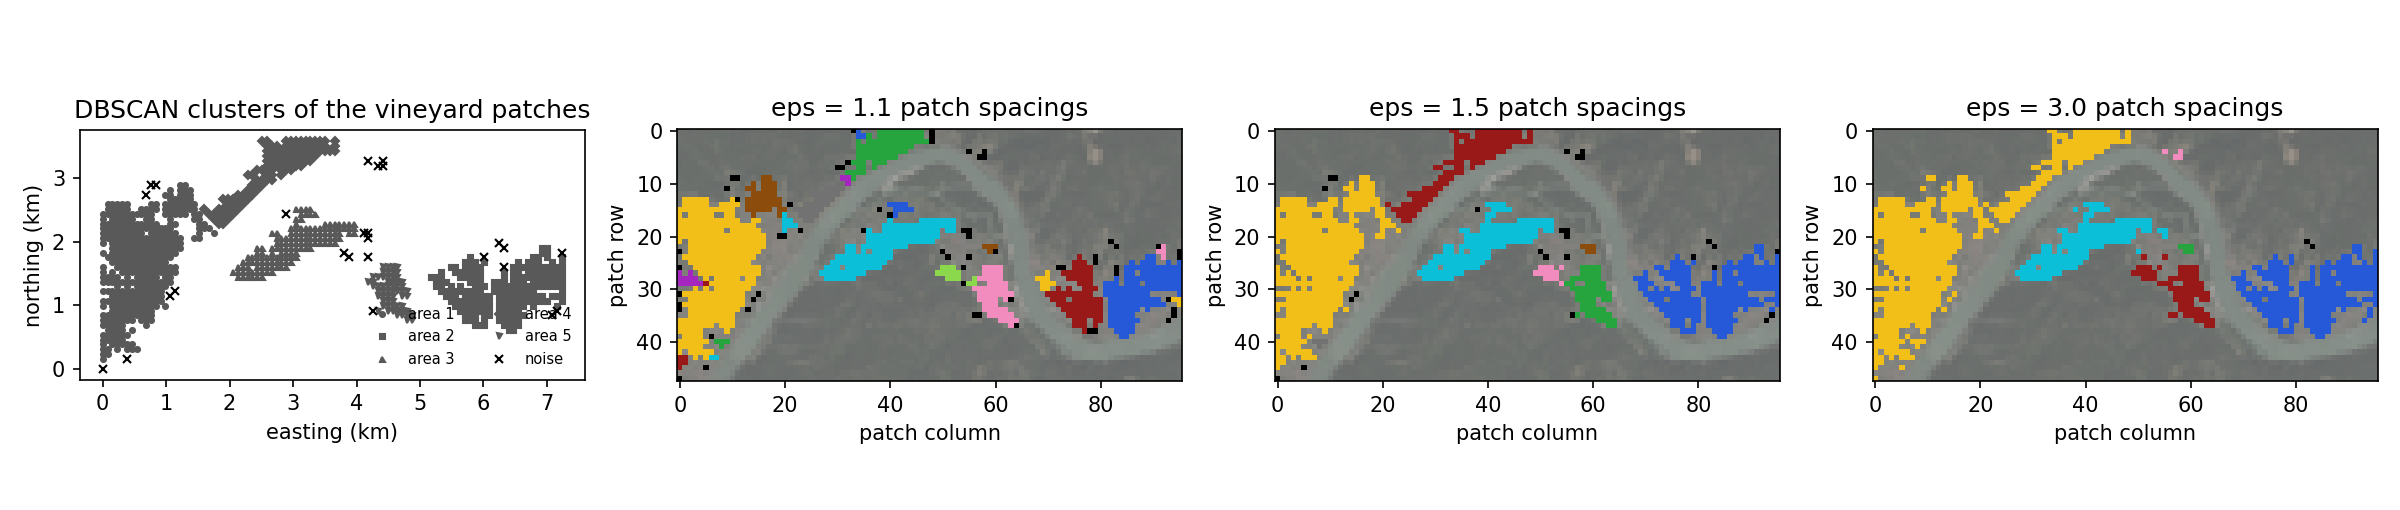
B-plot writes when the script runsDictionary of Applied Machine Learning · density-based spatial clustering of applications with noise (DBSCAN)
Updated on 2026-11-03
Numerical companion to the entry density-based spatial clustering of applications with noise (DBSCAN): it recomputes what the entry states and prints one line per check
Numerical companion to the glossary entry 'dbscan'. The aerial photograph assets/wachau_ortho.jpg (Weissenkirchen, Rossatz, Duernstein and the Loiben slopes along the Danube bend; 7.31 x 3.65 km; orthophoto (c) basemap.at, CC BY 4.0) is cut into square patches of 76 m, and the parcel mask assets/wachau_labels.png (INVEKOS Schlaege 2025-1, AgrarMarkt Austria, CC BY 3.0 AT) selects the patches that lie mostly on vineyard parcels. These are the data points, each with its position (easting, northing) in km as feature vector, and the wine-growing areas of the strip are the clusters to be found.
Run it without installing anything:uv run https://dictionaryofml.org/terms/dbscan.py
uv downloads this script and the pinned NumPy and Matplotlib it needs, then runs it; the script fetches any input file it uses. To keep the output files, download dbscan.py into a folder and run uv run dbscan.py there. With NumPy and Matplotlib already installed, python3 dbscan.py, from any directory — it writes its output files into the current directory. Fixed seeds, so the printed numbers reproduce exactly. Download dbscan.py · Notebook · Open in Colab
Before running a downloaded copy, scan it: uvx bandit -q -t B102,B307,B602,B605 dbscan.py (B102,B307,B602,B605 are the exec, eval and shell checks of bandit) reports nothing: the script runs no shell command and evaluates no generated code.
One cell per block of the script: the code, and what that code printed when it last ran here
"""DBSCAN on the vineyard patches of an aerial photograph of the Wachau:
core points, noise, the effect of eps, and the comparison with k-means.

Purpose
-------
Numerical companion to the glossary entry 'dbscan'.  The aerial
photograph assets/wachau_ortho.jpg (Weissenkirchen, Rossatz, Duernstein
and the Loiben slopes along the Danube bend; 7.31 x 3.65 km; orthophoto
(c) basemap.at, CC BY 4.0) is cut into square patches of 76 m, and the
parcel mask assets/wachau_labels.png (INVEKOS Schlaege 2025-1,
AgrarMarkt Austria, CC BY 3.0 AT) selects the patches that lie mostly on
vineyard parcels.  These are the data points, each with its position
(easting, northing) in km as feature vector, and the wine-growing areas
of the strip are the clusters to be found.

The demo checks the entry's claims: every DBSCAN cluster is a maximal
set of patches connected through core points at most eps apart; every
noise patch has fewer than minPts patches within eps; DBSCAN is a
single pass (a second run on its own output changes nothing); the
number of clusters is an output that falls as eps grows, while the
noise share falls too; and k-means with the same number of clusters
splits at least one area and joins two areas in one cluster.

Deterministic: DBSCAN has no random choices; k-means is initialized by
splitting the patches into equal parts ordered by easting.
Self-contained: numpy + matplotlib only.

Blocks
------
[B-patches] Cut the photograph into 32x32-pixel patches (76 m), select
            the patches that lie mostly on vineyard parcels, and take
            their positions in km as feature vectors.
[B-dbscan]  DBSCAN with eps = 1.5 patch spacings and minPts = 4: core
            points, clusters as connected components of the
            eps-neighborhood graph on the core points, border points,
            noise.  Check the connectivity of every cluster, the noise
            condition, and that the result is reached in one pass.
[B-eps]     The same with eps = 1.1, 1.5 and 3.0 patch spacings: the
            number of clusters and the noise share as eps grows.  Check
            that both fall.
[B-kmeans]  k-means with as many clusters as DBSCAN found areas of at
            least 20 patches: check that it splits at least one area
            and that one of its clusters joins two areas.
[B-images]  The photograph at patch resolution with the vineyard patches
            marked, and one painted copy per eps (noise in black).
[B-plot]    Write the positions of the patches of each area, of the
            small clusters and of the noise for the entry's scatter,
            plus the preview.

Outputs
-------
dbscan_points_area1.csv ... dbscan_points_area5.csv : x1, x2 -- the
                       patches of the five wine-growing areas, ordered
                       by size
dbscan_points_small.csv : x1, x2 -- the patches of the clusters with
                       fewer than 20 patches
dbscan_points_noise.csv : x1, x2 -- the noise patches
dbscan_wachau_vineyard.png : the photograph at patch resolution with
                       the vineyard patches marked
dbscan_wachau_eps1.png, _eps2.png, _eps3.png : the vineyard patches
                       painted by cluster for eps = 1.1, 1.5, 3.0 patch
                       spacings (noise in black)
dbscan.png : preview (checking only) -- the scatter and the three
             painted copies
"""

# /// script
# requires-python = ">=3.10"
# dependencies = ["matplotlib==3.10.7", "numpy==2.3.4"]
# ///

from pathlib import Path

import urllib.request

import numpy as np
import matplotlib

matplotlib.use("Agg")
import matplotlib.pyplot as plt
from matplotlib.image import imread

OUT_DIR = Path(__file__).parent

ASSET_URL = "https://dictionaryofml.org/demoassets/"


def demo_asset(name):
    """Path to the input file `name`, fetched once if it is not already here.

    Inside the repository the committed copy is used (pythondemos/ first,
    then assets/), so a run there reproduces the committed outputs exactly.
    Run from anywhere else -- from the copy published on dictionaryofml.org,
    say -- the file is downloaded and cached beside the script, so the demo
    is runnable without the repository.
    """
    for cand in (OUT_DIR / name, OUT_DIR.parent / "assets" / name):
        if cand.exists():
            return cand
    cached = OUT_DIR / name
    print(f"    fetching {name} from {ASSET_URL}{name}")
    with urllib.request.urlopen(ASSET_URL + name, timeout=180) as resp:
        cached.write_bytes(resp.read())
    return cached

report = []                         # collects (check name, pass/fail) pairs


def check(name, ok):                # records and prints one verification
    report.append((name, bool(ok)))
    print(f"  [{'ok' if ok else 'FAIL'}] {name}")
1000 vineyard patches of 4608, spaced 76 m
Cut the photograph into 32x32-pixel patches (76 m), select the patches that lie mostly on vineyard parcels, and take their positions in km as feature vectors.
PATCH = 32
WIDTH_KM = 7.31                     # the strip is 7.31 km wide
photo = imread(demo_asset("wachau_ortho.jpg")) / 255.0
labels = np.asarray(imread(demo_asset("wachau_labels.png")))
if labels.ndim == 3:
    labels = labels[:, :, 0]
if labels.max() <= 1.0 and labels.dtype != np.uint8:
    labels = np.rint(labels * 255).astype(np.uint8)
rows = photo.shape[0] // PATCH
cols = photo.shape[1] // PATCH
tiles = photo[:rows * PATCH, :cols * PATCH].reshape(
    rows, PATCH, cols, PATCH, 3).mean(axis=(1, 3))
share = (labels[:rows * PATCH, :cols * PATCH] == 1).reshape(
    rows, PATCH, cols, PATCH).mean(axis=(1, 3))
spacing = PATCH * WIDTH_KM / photo.shape[1]           # km between patches
grid_r, grid_c = np.divmod(np.arange(rows * cols), cols)
positions = np.column_stack([grid_c * spacing, (rows - 1 - grid_r) * spacing])
is_vine = share.ravel() > 0.5
X = positions[is_vine]                                # the data points
vine_r, vine_c = grid_r[is_vine], grid_c[is_vine]
print(f"  {len(X)} vineyard patches of {rows * cols}, spaced {1000 * spacing:.0f} m")
check("[B-patches] every vineyard patch has a two-number feature vector",
      X.shape == (is_vine.sum(), 2) and 900 < len(X) < 1100)
dist = np.sqrt(((X[:, None, :] - X[None, :, :]) ** 2).sum(axis=2))
  [ok] [B-patches] every vineyard patch has a two-number feature vector
  eps = 1.5 spacings, minPts = 4: 934 core points, 40 border points, 26 noise; 8 clusters of sizes [397, 234, 139, 122, 60, 13, 5, 4]; 5 with at least 20 patches
DBSCAN with eps = 1.5 patch spacings and minPts = 4: core points, clusters as connected components of the eps-neighborhood graph on the core points, border points, noise. Check the connectivity of every cluster, the noise condition, and that the result is reached in one pass.
def dbscan(dist, eps, min_pts):
    """DBSCAN: labels (-1 = noise) and the core-point indicator."""
    within = dist <= eps
    core = within.sum(axis=1) >= min_pts           # counting the point itself
    lab = -np.ones(len(core), dtype=int)
    current = 0
    for seed in range(len(core)):
        if lab[seed] != -1 or not core[seed]:
            continue
        lab[seed] = current
        stack = [seed]
        while stack:
            u = stack.pop()
            if not core[u]:
                continue                        # border points do not expand
            for v in np.flatnonzero(within[u]):
                if lab[v] == -1:
                    lab[v] = current
                    stack.append(v)
        current += 1
    return lab, core


def components(mask, adjacency):
    """Number of connected components of the subgraph induced by mask."""
    seen = np.zeros(len(mask), dtype=bool)
    count = 0
    for s in np.flatnonzero(mask):
        if seen[s]:
            continue
        count += 1
        stack = [s]
        seen[s] = True
        while stack:
            u = stack.pop()
            for v in np.flatnonzero(adjacency[u] & mask & ~seen):
                seen[v] = True
                stack.append(v)
    return count


EPS = 1.5 * spacing
MIN_PTS = 4
lab, core = dbscan(dist, EPS, MIN_PTS)
within = dist <= EPS
n_clusters = lab.max() + 1
sizes = np.bincount(lab[lab >= 0])
order = np.argsort(-sizes)                          # largest cluster first
lab = np.where(lab >= 0, np.argsort(order)[np.maximum(lab, 0)], -1)
sizes = sizes[order]
areas = [c for c in range(n_clusters) if sizes[c] >= 20]
border = (lab >= 0) & ~core
print(f"  eps = 1.5 spacings, minPts = {MIN_PTS}: {int(core.sum())} core points, "
      f"{int(border.sum())} border points, {int((lab < 0).sum())} noise; "
      f"{n_clusters} clusters of sizes {sizes.tolist()}; {len(areas)} with "
      f"at least 20 patches")
check("[B-dbscan] every cluster is connected through core points at most "
      "eps apart",
      all(components((lab == c) & core, within) == 1 for c in range(n_clusters)))
check("[B-dbscan] every border point lies within eps of a core point of its "
      "cluster",
      all(bool(np.any(within[i] & core & (lab == lab[i])))
          for i in np.flatnonzero(border)))
check("[B-dbscan] every noise patch has fewer than minPts patches within eps",
      bool(np.all(within[lab < 0].sum(axis=1) < MIN_PTS)))
# one pass: rerunning on the clustered patches only reproduces the clusters
lab_again, _ = dbscan(dist[lab >= 0][:, lab >= 0], EPS, MIN_PTS)
same = all(len(np.unique(lab_again[lab[lab >= 0] == c])) == 1
           and np.all(lab_again[lab[lab >= 0] == c] >= 0) for c in range(n_clusters))
check("[B-dbscan] a second pass over the clustered patches changes nothing",
      same and lab_again.max() + 1 == n_clusters)
  [ok] [B-dbscan] every cluster is connected through core points at most eps apart
  [ok] [B-dbscan] every border point lies within eps of a core point of its cluster
  [ok] [B-dbscan] every noise patch has fewer than minPts patches within eps
  [ok] [B-dbscan] a second pass over the clustered patches changes nothing
  eps = 1.1 spacings: 24 clusters (8 with at least 20 patches), 6% noise
  eps = 1.5 spacings: 8 clusters (5 with at least 20 patches), 3% noise
  eps = 3.0 spacings: 6 clusters (4 with at least 20 patches), 0% noise
The same with eps = 1.1, 1.5 and 3.0 patch spacings: the number of clusters and the noise share as eps grows. Check that both fall.
EPS_FACTORS = (1.1, 1.5, 3.0)
sweep = []
for f in EPS_FACTORS:
    lab_f, core_f = dbscan(dist, f * spacing, MIN_PTS)
    n_f = lab_f.max() + 1
    big_f = int((np.bincount(lab_f[lab_f >= 0]) >= 20).sum()) if n_f else 0
    sweep.append((lab_f, n_f, big_f, float((lab_f < 0).mean())))
    print(f"  eps = {f:.1f} spacings: {n_f} clusters ({big_f} with at least 20 "
          f"patches), {100 * sweep[-1][3]:.0f}% noise")
check("[B-eps] the number of clusters falls as eps grows",
      sweep[0][1] > sweep[1][1] > sweep[2][1])
check("[B-eps] the noise share falls as eps grows",
      sweep[0][3] > sweep[1][3] > sweep[2][3])
check("[B-eps] the largest eps joins areas that eps = 1.5 keeps apart",
      sweep[2][2] < len(areas))
  [ok] [B-eps] the number of clusters falls as eps grows
  [ok] [B-eps] the noise share falls as eps grows
  [ok] [B-eps] the largest eps joins areas that eps = 1.5 keeps apart
  k-means with k = 5: splits 1 area(s), 1 cluster(s) join two areas
k-means with as many clusters as DBSCAN found areas of at least 20 patches: check that it splits at least one area and that one of its clusters joins two areas.
def assign(A, cents):
    return ((A[:, None, :] - cents) ** 2).sum(axis=2).argmin(axis=1)


def lloyd(A, cents):
    lab_k = assign(A, cents)
    for _ in range(300):
        new = np.stack([A[lab_k == c].mean(axis=0) if (lab_k == c).any()
                        else cents[c] for c in range(len(cents))])
        new_lab = assign(A, new)
        if np.array_equal(new_lab, lab_k) and np.allclose(new, cents):
            return new_lab
        lab_k, cents = new_lab, new
    return lab_k


NRCLUSTER = len(areas)
parts = np.array_split(np.argsort(X[:, 0]), NRCLUSTER)
lab_km = lloyd(X, np.stack([X[g].mean(axis=0) for g in parts]))
split = sum(int((np.bincount(lab_km[lab == a], minlength=NRCLUSTER) >= 20).sum() >= 2)
            for a in areas)
join = sum(int(sum(int(((lab_km == c) & (lab == a)).sum()) >= 20 for a in areas) >= 2)
           for c in range(NRCLUSTER))
print(f"  k-means with k = {NRCLUSTER}: splits {split} area(s), {join} cluster(s) "
      f"join two areas")
check("[B-kmeans] k-means splits at least one wine-growing area", split >= 1)
check("[B-kmeans] at least one k-means cluster joins two areas", join >= 1)
  [ok] [B-kmeans] k-means splits at least one wine-growing area
  [ok] [B-kmeans] at least one k-means cluster joins two areas
The photograph at patch resolution with the vineyard patches marked, and one painted copy per eps (noise in black).
def save_image(arr, name, zoom=3):
    img = np.clip(arr, 0.0, 1.0).repeat(zoom, axis=0).repeat(zoom, axis=1)
    plt.imsave(OUT_DIR / name, img)


PALETTE = np.array([[0.95, 0.75, 0.10], [0.15, 0.35, 0.85], [0.05, 0.75, 0.85],
                    [0.60, 0.10, 0.10], [0.15, 0.65, 0.25], [0.95, 0.55, 0.75],
                    [0.55, 0.30, 0.05], [0.45, 0.45, 0.45], [0.65, 0.15, 0.75],
                    [0.55, 0.85, 0.30]])   # ordered by distinct brightness
dimmed = 0.35 * tiles + 0.35
marked = dimmed.copy()
marked[vine_r, vine_c] = tiles[vine_r, vine_c]
save_image(marked, "dbscan_wachau_vineyard.png")


def paint(lab_p, name):
    img = dimmed.copy()
    for i, (r, c) in enumerate(zip(vine_r, vine_c)):
        img[r, c] = PALETTE[lab_p[i] % len(PALETTE)] if lab_p[i] >= 0 else 0.0
    save_image(img, name)
    return img


painted = []
for i, (lab_f, _, _, _) in enumerate(sweep, start=1):
    sizes_f = np.bincount(lab_f[lab_f >= 0])
    relabel = np.argsort(np.argsort(-sizes_f))     # largest cluster first
    lab_f = np.where(lab_f >= 0, relabel[np.maximum(lab_f, 0)], -1)
    painted.append(paint(lab_f, f"dbscan_wachau_eps{i}.png"))
check("[B-images] one painted copy per eps",
      all((OUT_DIR / f"dbscan_wachau_eps{i}.png").exists() for i in (1, 2, 3)))
[ok] [B-images] one painted copy per eps
Write the positions of the patches of each area, of the small clusters and of the noise for the entry's scatter, plus the preview.
def write_points(name, sel):
    with open(OUT_DIR / name, "w") as f:
        f.write("x1,x2\n")
        for a, b in X[sel]:
            f.write(f"{a:.4f},{b:.4f}\n")


for i, a in enumerate(areas, start=1):
    write_points(f"dbscan_points_area{i}.csv", lab == a)
write_points("dbscan_points_small.csv", (lab >= 0) & ~np.isin(lab, areas))
write_points("dbscan_points_noise.csv", lab < 0)

fig, axes = plt.subplots(1, 4, figsize=(16, 3.4))
ax = axes[0]
markers = ("o", "s", "^", "D", "v", "p", "h")
for i, a in enumerate(areas):
    ax.plot(X[lab == a, 0], X[lab == a, 1], markers[i], color="0.35",
            markersize=2.4, linestyle="none", label=f"area {i + 1}")
ax.plot(X[lab < 0, 0], X[lab < 0, 1], "x", color="black", markersize=4,
        linestyle="none", label="noise")
ax.set_aspect("equal")
ax.set_xlabel("easting (km)")
ax.set_ylabel("northing (km)")
ax.set_title("DBSCAN clusters of the vineyard patches")
ax.legend(frameon=False, fontsize=7, loc="lower right", ncol=2)
for ax, img, f in zip(axes[1:], painted, EPS_FACTORS):
    ax.imshow(np.clip(img, 0, 1))
    ax.set_title(f"eps = {f:.1f} patch spacings")
    ax.set_xlabel("patch column")
    ax.set_ylabel("patch row")
fig.tight_layout()
fig.savefig(OUT_DIR / "dbscan.png", dpi=150)
plt.close(fig)
check("[B-plot] the scatter files were written",
      (OUT_DIR / "dbscan_points_noise.csv").exists()
      and (OUT_DIR / f"dbscan_points_area{len(areas)}.csv").exists())

passed = sum(1 for _, ok in report if ok)
print(f"\n{passed}/{len(report)} checks pass")
  [ok] [B-plot] the scatter files were written

12/12 checks pass
B-plot writes when the script runs