B-plot writes when the script runsDictionary of Applied Machine Learning · edge weight
Updated on 2026-11-19
Numerical companion to the entry edge weight: it recomputes what the entry states and prints one line per check
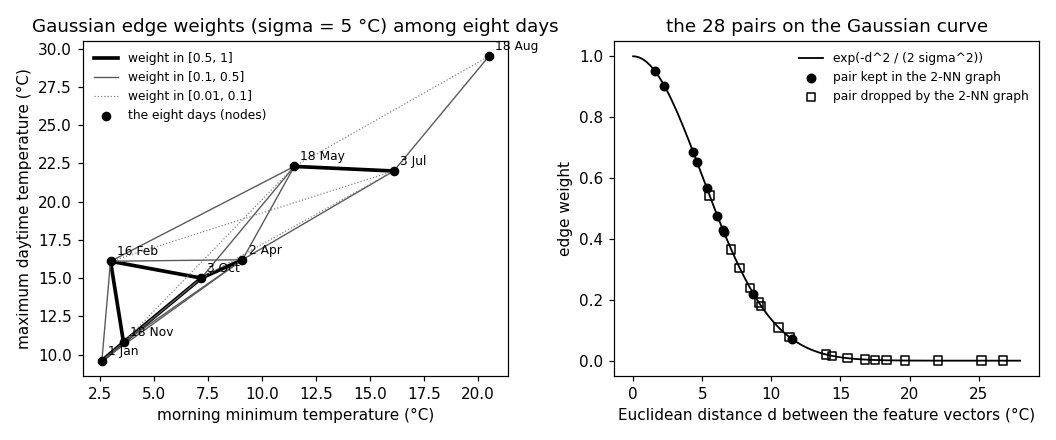
Numerical companion to the glossary entry 'edgeweight'. Eight days of 2024 at Krems, every 46th day from 1 January, are the nodes of a graph. Each day is a data point with the feature vector (morning minimum temperature, maximum daytime temperature). The edge weight of a pair of days is the Gaussian similarity exp(-d^2 / (2 sigma^2)) of their feature vectors, with d their Euclidean distance and sigma = 5 degrees Celsius.
Run it without installing anything:uv run https://dictionaryofml.org/terms/edgeweight.py
uv downloads this script and the pinned NumPy and Matplotlib it needs, then runs it; the script fetches any input file it uses. To keep the output files, download edgeweight.py into a folder and run uv run edgeweight.py there. With NumPy and Matplotlib already installed, python3 edgeweight.py, from any directory — it writes its output files into the current directory. Fixed seeds, so the printed numbers reproduce exactly. Download edgeweight.py · Notebook · Open in Colab
Before running a downloaded copy, scan it: uvx bandit -q -t B102,B307,B602,B605 edgeweight.py (B102,B307,B602,B605 are the exec, eval and shell checks of bandit) reports nothing: the script runs no shell command and evaluates no generated code.
One cell per block of the script: the code, and what that code printed when it last ran here
"""Edge weights among eight days at Krems an der Donau: the Gaussian
similarity of their feature vectors, the k-nearest-neighbor graph, and the
weighted sums that graph clustering and convex clustering build from them.

Purpose
-------
Numerical companion to the glossary entry 'edgeweight'.  Eight days of
2024 at Krems, every 46th day from 1 January, are the nodes of a graph.
Each day is a data point with the feature vector (morning minimum
temperature, maximum daytime temperature).  The edge weight of a pair of
days is the Gaussian similarity exp(-d^2 / (2 sigma^2)) of their feature
vectors, with d their Euclidean distance and sigma = 5 degrees Celsius.

The demo checks the entry's claims: the weight matrix is symmetric with a
zero diagonal and entries in (0, 1]; the weight falls with the distance
and is exp(-1/2) at distance sigma; the width sigma decides how many
pairs carry a visible weight; the k-nearest-neighbor graph keeps few of
the 28 pairs and stays connected; the Laplacian quadratic form of a node
signal is the weighted sum of its squared differences over the edges, and
for the indicator of a cluster it is the total weight of the edges that
leave the cluster; the fusion penalty of convex clustering for a hard
clustering is the distance between the two centroids times that total
weight.

Deterministic (no randomness).  Self-contained: numpy + matplotlib only;
the GeoSphere download falls back to the committed CSV.

Blocks
------
[B-data]      Download the daily minimum and maximum temperature of 2024
              at Krems (GeoSphere station 3805) or read the committed
              copy; 366 days, no missing value.
[B-days]      Every 46th day as a node: eight days, their feature vectors
              and pairwise Euclidean distances; the nearest and the
              farthest pair.
[B-weights]   Gaussian edge weights with sigma = 5: symmetric weight
              matrix, zero diagonal, entries in (0, 1]; the weight of the
              nearest and of the farthest pair; how many of the 28 pairs
              weigh at least 0.5 and how many below 0.01; the same counts
              for sigma = 1 and sigma = 50.
[B-knn]       The 2-nearest-neighbor graph: an edge whenever either day is
              among the two nearest neighbors of the other; its number of
              edges, its connectivity, the weights it keeps and drops.
[B-quadform]  The Laplacian quadratic form of a node signal equals the
              weighted sum of squared differences over the edges; for the
              indicator of the cold days it is the total weight of the
              edges between cold and warm days, smaller than for a split
              by calendar; the convex-clustering penalty of the hard
              clustering is the centroid distance times that total weight.
[B-plot]      CSVs for the figure (nodes, edges in three weight classes,
              the 28 pairs, the Gaussian curve) and the preview.

Outputs
-------
edgeweight_weather.csv       : date, tmin, tmax (committed copy).
edgeweight_nodes.csv         : the eight days: index, date, label, tmin,
                               tmax, cold (1 for a cold day), and the
                               anchor of the label in the figure.
edgeweight_edges_strong.csv  : edges with weight >= 0.5 as NaN-separated
                               paths (x, y).
edgeweight_edges_medium.csv  : edges with 0.1 <= weight < 0.5.
edgeweight_edges_weak.csv    : edges with 0.01 <= weight < 0.1.
edgeweight_pairs.csv         : the 28 pairs: i, j, distance, weight, knn
                               (1 if the pair is an edge of the 2-NN graph).
edgeweight_curve.csv         : distance, weight for the Gaussian curve.
edgeweight.png               : matplotlib preview (checking only).
"""

# /// script
# requires-python = ">=3.10"
# dependencies = ["matplotlib==3.10.7", "numpy==2.3.4"]
# ///

import json
import urllib.request
from pathlib import Path

import numpy as np
import matplotlib

matplotlib.use("Agg")
import matplotlib.pyplot as plt

OUT_DIR = Path(__file__).parent

report = []


def check(name, ok):
    report.append((name, bool(ok)))
    print(f"  [{'ok' if ok else 'FAIL'}] {name}")
Download the daily minimum and maximum temperature of 2024 at Krems (GeoSphere station 3805) or read the committed copy; 366 days, no missing value.
print("[B-data] daily minimum and maximum temperature at Krems, 2024")
URL = ("https://dataset.api.hub.geosphere.at/v1/station/historical/"
       "klima-v2-1d?parameters=tlmin,tlmax&station_ids=3805"
       "&start=2024-01-01&end=2024-12-31")
CSV = OUT_DIR / "edgeweight_weather.csv"
try:
    with urllib.request.urlopen(URL, timeout=120) as resp:
        payload = json.load(resp)
    params = payload["features"][0]["properties"]["parameters"]
    records = [(stamp[:10], lo, hi)
               for stamp, lo, hi in zip(payload["timestamps"],
                                        params["tlmin"]["data"],
                                        params["tlmax"]["data"])]
    with open(CSV, "w") as fh:
        fh.write("date,tmin,tmax\n")
        for day, lo, hi in records:
            fh.write(f"{day},{lo},{hi}\n")
    print(f"    downloaded {len(records)} days")
except OSError as err:
    print(f"    download failed ({err}); reading the committed CSV")
    rows = CSV.read_text().strip().splitlines()[1:]
    records = [(d, float(a), float(b))
               for d, a, b in (r.split(",") for r in rows)]

check("[B-data] 366 days for 2024", len(records) == 366)
check("[B-data] no day is missing a temperature",
      all(lo is not None and hi is not None for _, lo, hi in records))
X_all = np.array([[lo, hi] for _, lo, hi in records], dtype=float)
[B-data] daily minimum and maximum temperature at Krems, 2024
    downloaded 366 days
  [ok] [B-data] 366 days for 2024
  [ok] [B-data] no day is missing a temperature
Every 46th day as a node: eight days, their feature vectors and pairwise Euclidean distances; the nearest and the farthest pair.
print("[B-days] every 46th day of 2024 as a node")
STEP = 46
idx = np.arange(0, len(X_all), STEP)
X = X_all[idx]
dates = [records[i][0] for i in idx]
MONTHS = ["Jan", "Feb", "Mar", "Apr", "May", "Jun",
          "Jul", "Aug", "Sep", "Oct", "Nov", "Dec"]
labels = [f"{int(d[8:10])} {MONTHS[int(d[5:7]) - 1]}" for d in dates]
n = len(X)
check(f"[B-days] {n} nodes: " + ", ".join(labels), n == 8)
D = np.sqrt(((X[:, None, :] - X[None, :, :]) ** 2).sum(axis=-1))
iu = np.triu_indices(n, 1)
pairs = list(zip(iu[0], iu[1]))
check(f"[B-days] {len(pairs)} pairs of days", len(pairs) == n * (n - 1) // 2)
near = min(pairs, key=lambda p: D[p])
far = max(pairs, key=lambda p: D[p])
check(f"[B-days] nearest pair {labels[near[0]]} and {labels[near[1]]} at "
      f"distance {D[near]:.1f}; farthest pair {labels[far[0]]} and "
      f"{labels[far[1]]} at distance {D[far]:.1f}",
      D[near] < 2 and D[far] > 25)
[B-days] every 46th day of 2024 as a node
  [ok] [B-days] 8 nodes: 1 Jan, 16 Feb, 2 Apr, 18 May, 3 Jul, 18 Aug, 3 Oct, 18 Nov
  [ok] [B-days] 28 pairs of days
  [ok] [B-days] nearest pair 1 Jan and 18 Nov at distance 1.6; farthest pair 1 Jan and 18 Aug at distance 26.8
Gaussian edge weights with sigma = 5: symmetric weight matrix, zero diagonal, entries in (0, 1]; the weight of the nearest and of the farthest pair; how many of the 28 pairs weigh at least 0.5 and how many below 0.01; the same counts for sigma = 1 and sigma = 50.
def gaussian_weights(D, sigma):
    """Weight matrix of the fully connected graph: Gaussian similarity of
    the feature vectors, zero on the diagonal (no self-loops)."""
    A = np.exp(-D ** 2 / (2 * sigma ** 2))
    np.fill_diagonal(A, 0.0)
    return A


print("[B-weights] Gaussian edge weights of the eight days")
SIGMA = 5.0
A = gaussian_weights(D, SIGMA)
w = A[iu]
check("[B-weights] the weight matrix is symmetric with a zero diagonal",
      np.allclose(A, A.T) and np.all(np.diag(A) == 0))
check("[B-weights] every weight lies in (0, 1]",
      np.all(w > 0) and np.all(w <= 1))
check("[B-weights] the weight falls with the distance: larger distance, "
      "smaller weight, for every two pairs",
      np.all(np.diff(w[np.argsort(D[iu])]) <= 1e-15))
check(f"[B-weights] weight at distance sigma = {SIGMA:.0f}: "
      f"exp(-1/2) = {np.exp(-0.5):.2f}",
      abs(np.exp(-D[near] ** 2 / (2 * SIGMA ** 2)) - A[near]) < 1e-12)
check(f"[B-weights] nearest pair weight {A[near]:.2f}; farthest pair "
      f"weight {A[far]:.1e}", A[near] > 0.9 and A[far] < 1e-5)
n_strong, n_weak = int(np.sum(w >= 0.5)), int(np.sum(w < 0.01))
n_medium = int(np.sum((w >= 0.1) & (w < 0.5)))
n_faint = int(np.sum((w >= 0.01) & (w < 0.1)))
check(f"[B-weights] sigma = {SIGMA:.0f}: {n_strong} pairs weigh at least "
      f"0.5, {n_medium} between 0.1 and 0.5, {n_faint} between 0.01 and "
      f"0.1, {n_weak} below 0.01", n_strong + n_medium + n_faint + n_weak
      == len(pairs))
A1, A50 = gaussian_weights(D, 1.0), gaussian_weights(D, 50.0)
check(f"[B-weights] sigma = 1: {int(np.sum(A1[iu] >= 0.01))} of the "
      f"{len(pairs)} pairs weigh at least 0.01; sigma = 50: the smallest "
      f"weight is {A50[iu].min():.2f}",
      np.sum(A1[iu] >= 0.01) <= 2 and A50[iu].min() > 0.85)
[B-weights] Gaussian edge weights of the eight days
  [ok] [B-weights] the weight matrix is symmetric with a zero diagonal
  [ok] [B-weights] every weight lies in (0, 1]
  [ok] [B-weights] the weight falls with the distance: larger distance, smaller weight, for every two pairs
  [ok] [B-weights] weight at distance sigma = 5: exp(-1/2) = 0.61
  [ok] [B-weights] nearest pair weight 0.95; farthest pair weight 6.0e-07
  [ok] [B-weights] sigma = 5: 6 pairs weigh at least 0.5, 10 between 0.1 and 0.5, 4 between 0.01 and 0.1, 8 below 0.01
  [ok] [B-weights] sigma = 1: 2 of the 28 pairs weigh at least 0.01; sigma = 50: the smallest weight is 0.87
The 2-nearest-neighbor graph: an edge whenever either day is among the two nearest neighbors of the other; its number of edges, its connectivity, the weights it keeps and drops.
print("[B-knn] the 2-nearest-neighbor graph")
K = 2
nearest = np.argsort(D + np.eye(n) * 1e9, axis=1)[:, :K]
E_knn = np.zeros((n, n), dtype=bool)
for i in range(n):
    for j in nearest[i]:
        E_knn[i, j] = E_knn[j, i] = True
A_knn = np.where(E_knn, A, 0.0)
knn_pairs = [p for p in pairs if E_knn[p]]
check(f"[B-knn] {len(knn_pairs)} of the {len(pairs)} pairs are edges of "
      f"the {K}-NN graph", 0 < len(knn_pairs) < len(pairs))
check("[B-knn] the sparsified weight matrix stays symmetric",
      np.allclose(A_knn, A_knn.T))
reach = {0}
frontier = [0]
while frontier:
    i = frontier.pop()
    for j in np.flatnonzero(E_knn[i]):
        if j not in reach:
            reach.add(j)
            frontier.append(j)
check(f"[B-knn] the {K}-NN graph is connected", len(reach) == n)
kept = np.array([A[p] for p in knn_pairs])
dropped_pairs = [p for p in pairs if not E_knn[p]]
heavy = max(dropped_pairs, key=lambda p: A[p])
light = min(knn_pairs, key=lambda p: A[p])
check(f"[B-knn] kept weights range from {kept.min():.2f} ({labels[light[0]]}"
      f" and {labels[light[1]]}) to {kept.max():.2f}; the heaviest dropped "
      f"pair, {labels[heavy[0]]} and {labels[heavy[1]]}, weighs "
      f"{A[heavy]:.2f}: the {K}-NN graph is not a threshold on the weights",
      A[heavy] > kept.min())
check(f"[B-knn] both days of the dropped pair have {K} closer neighbors "
      f"than each other",
      all(np.sum(D[i] < D[heavy]) >= K + 1 for i in heavy))
[B-knn] the 2-nearest-neighbor graph
  [ok] [B-knn] 10 of the 28 pairs are edges of the 2-NN graph
  [ok] [B-knn] the sparsified weight matrix stays symmetric
  [ok] [B-knn] the 2-NN graph is connected
  [ok] [B-knn] kept weights range from 0.07 (18 May and 18 Aug) to 0.95; the heaviest dropped pair, 3 Oct and 18 Nov, weighs 0.54: the 2-NN graph is not a threshold on the weights
  [ok] [B-knn] both days of the dropped pair have 2 closer neighbors than each other
The Laplacian quadratic form of a node signal equals the weighted sum of squared differences over the edges; for the indicator of the cold days it is the total weight of the edges between cold and warm days, smaller than for a split by calendar; the convex-clustering penalty of the hard clustering is the centroid distance times that total weight.
print("[B-quadform] the Laplacian quadratic form and the fusion penalty")
L = np.diag(A.sum(axis=1)) - A


def quad_form(A, u):
    return float(u @ (np.diag(A.sum(axis=1)) - A) @ u)


def edge_sum(A, u):
    return float(sum(A[i, j] * (u[i] - u[j]) ** 2 for i, j in pairs))


rng_signal = X[:, 1] - X[:, 1].mean()        # a node signal: centered tmax
check("[B-quadform] u^T L u equals the weighted sum over the edges of "
      "(u_i - u_i')^2, for the maximum temperatures as node signal",
      abs(quad_form(A, rng_signal) - edge_sum(A, rng_signal)) < 1e-9)
cold = (X[:, 1] < 20).astype(float)          # cold day: maximum below 20
n_cold = int(cold.sum())
cut_cold = float(sum(A[i, j] for i, j in pairs if cold[i] != cold[j]))
check(f"[B-quadform] indicator of the {n_cold} cold days (maximum below "
      f"20 degrees): u^T L u = {quad_form(A, cold):.2f} equals the total "
      f"weight {cut_cold:.2f} of the edges between cold and warm days",
      abs(quad_form(A, cold) - cut_cold) < 1e-9)
calendar = (np.arange(n) < n // 2).astype(float)
cut_cal = float(sum(A[i, j] for i, j in pairs if calendar[i] != calendar[j]))
check(f"[B-quadform] a split into the first four and the last four days "
      f"cuts total weight {cut_cal:.2f}, more than the cold/warm split",
      cut_cal > cut_cold)
c_cold, c_warm = X[cold == 1].mean(axis=0), X[cold == 0].mean(axis=0)
W_hard = np.where(cold[:, None] == 1, c_cold, c_warm)
penalty = float(sum(A[i, j] * np.linalg.norm(W_hard[i] - W_hard[j])
                    for i, j in pairs))
dist_c = float(np.linalg.norm(c_cold - c_warm))
check(f"[B-quadform] convex-clustering penalty of the hard clustering: "
      f"{penalty:.1f} = centroid distance {dist_c:.1f} times the total "
      f"weight {cut_cold:.2f}", abs(penalty - dist_c * cut_cold) < 1e-9)
check(f"[B-quadform] total weight of all {len(pairs)} pairs: {w.sum():.2f}; "
      f"the cold/warm split cuts {100 * cut_cold / w.sum():.0f} percent of "
      f"it, the calendar split {100 * cut_cal / w.sum():.0f} percent",
      cut_cold < w.sum() / 2 < cut_cal)
[B-quadform] the Laplacian quadratic form and the fusion penalty
  [ok] [B-quadform] u^T L u equals the weighted sum over the edges of (u_i - u_i')^2, for the maximum temperatures as node signal
  [ok] [B-quadform] indicator of the 5 cold days (maximum below 20 degrees): u^T L u = 1.09 equals the total weight 1.09 of the edges between cold and warm days
  [ok] [B-quadform] a split into the first four and the last four days cuts total weight 4.97, more than the cold/warm split
  [ok] [B-quadform] convex-clustering penalty of the hard clustering: 17.0 = centroid distance 15.6 times the total weight 1.09
  [ok] [B-quadform] total weight of all 28 pairs: 7.44; the cold/warm split cuts 15 percent of it, the calendar split 67 percent
CSVs for the figure (nodes, edges in three weight classes, the 28 pairs, the Gaussian curve) and the preview.
print("[B-plot] nodes, edges by weight class, pairs, Gaussian curve")
# where the pgfplots label of a node sits (anchor of the label relative
# to the point), chosen so that no two labels overlap
ANCHOR = {"1 Jan": "north west", "18 Nov": "west", "16 Feb": "south west",
          "3 Oct": "north", "2 Apr": "north west", "18 May": "south east",
          "3 Jul": "south", "18 Aug": "south"}
with open(OUT_DIR / "edgeweight_nodes.csv", "w") as fh:
    fh.write("node,date,label,tmin,tmax,cold,anchor\n")
    for i in range(n):
        fh.write(f"{i + 1},{dates[i]},{labels[i]},{X[i, 0]:.1f},"
                 f"{X[i, 1]:.1f},{int(cold[i])},{ANCHOR[labels[i]]}\n")
CLASSES = {"strong": (0.5, 1.01), "medium": (0.1, 0.5), "weak": (0.01, 0.1)}
n_drawn = 0
for name, (lo, hi) in CLASSES.items():
    with open(OUT_DIR / f"edgeweight_edges_{name}.csv", "w") as fh:
        fh.write("x,y\n")                 # NaN rows break the path between edges
        for i, j in pairs:
            if lo <= A[i, j] < hi:
                fh.write(f"{X[i, 0]:.1f},{X[i, 1]:.1f}\n"
                         f"{X[j, 0]:.1f},{X[j, 1]:.1f}\nnan,nan\n")
                n_drawn += 1
check(f"[B-plot] {n_drawn} of the {len(pairs)} pairs are drawn as edges "
      f"(weight at least 0.01)", n_drawn == len(pairs) - n_weak)
with open(OUT_DIR / "edgeweight_pairs.csv", "w") as fh:
    fh.write("i,j,distance,weight,knn\n")
    for i, j in pairs:
        fh.write(f"{i + 1},{j + 1},{D[i, j]:.4f},{A[i, j]:.6f},"
                 f"{int(E_knn[i, j])}\n")
grid = np.linspace(0, 28, 141)
with open(OUT_DIR / "edgeweight_curve.csv", "w") as fh:
    fh.write("distance,weight\n")
    for d in grid:
        fh.write(f"{d:.2f},{np.exp(-d ** 2 / (2 * SIGMA ** 2)):.6f}\n")

fig, (ax1, ax2) = plt.subplots(1, 2, figsize=(9.6, 4.0))
STYLE = {"strong": dict(lw=2.4, ls="-", color="black"),
         "medium": dict(lw=0.9, ls="-", color="0.35"),
         "weak": dict(lw=0.8, ls=":", color="0.5")}
for name, (lo, hi) in CLASSES.items():
    first = True
    for i, j in pairs:
        if lo <= A[i, j] < hi:
            ax1.plot([X[i, 0], X[j, 0]], [X[i, 1], X[j, 1]], **STYLE[name],
                     label=f"weight in [{lo:.2g}, {hi if hi < 1 else 1:.2g}]"
                     if first else None)
            first = False
ax1.scatter(X[:, 0], X[:, 1], marker="o", color="black", s=28, zorder=3,
            label="the eight days (nodes)")
for i in range(n):
    ax1.annotate(labels[i], (X[i, 0], X[i, 1]), textcoords="offset points",
                 xytext=(4, 4), fontsize=8)
ax1.set_xlabel("morning minimum temperature (°C)")
ax1.set_ylabel("maximum daytime temperature (°C)")
ax1.set_title("Gaussian edge weights (sigma = 5 °C) among eight days")
ax1.legend(frameon=False, fontsize=8, loc="upper left")
ax2.plot(grid, np.exp(-grid ** 2 / (2 * SIGMA ** 2)), "k-", lw=1.2,
         label="exp(-d^2 / (2 sigma^2))")
knn_mask = np.array([E_knn[p] for p in pairs])
ax2.scatter(D[iu][knn_mask], w[knn_mask], marker="o", color="black", s=30,
            label="pair kept in the 2-NN graph")
ax2.scatter(D[iu][~knn_mask], w[~knn_mask], marker="s", facecolors="none",
            edgecolors="black", s=30, label="pair dropped by the 2-NN graph")
ax2.set_xlabel("Euclidean distance d between the feature vectors (°C)")
ax2.set_ylabel("edge weight")
ax2.set_title("the 28 pairs on the Gaussian curve")
ax2.legend(frameon=False, fontsize=8)
fig.tight_layout()
fig.savefig(OUT_DIR / "edgeweight.png", dpi=110)

n_ok = sum(ok for _, ok in report)
print(f"\n{n_ok}/{len(report)} checks pass")
if n_ok != len(report):
    raise SystemExit(1)
[B-plot] nodes, edges by weight class, pairs, Gaussian curve
  [ok] [B-plot] 20 of the 28 pairs are drawn as edges (weight at least 0.01)

23/23 checks pass
B-plot writes when the script runs