B-plot writes when the script runsDictionary of Applied Machine Learning · cluster
Updated on 2026-11-19
Numerical companion to the entry cluster: it recomputes what the entry states and prints one line per check
Numerical companion to the glossary entry 'cluster'. The 366 days of 2024 at Krems are data points with the feature vector (morning minimum temperature, maximum daytime temperature). A cluster is a subset of these days that are more similar to each other than to the days outside the subset, similarity being measured by the Euclidean distance between feature vectors.
Run it without installing anything:uv run https://dictionaryofml.org/terms/cluster.py
uv downloads this script and the pinned NumPy and Matplotlib it needs, then runs it; the script fetches any input file it uses. To keep the output files, download cluster.py into a folder and run uv run cluster.py there. With NumPy and Matplotlib already installed, python3 cluster.py, from any directory — it writes its output files into the current directory. Fixed seeds, so the printed numbers reproduce exactly. Download cluster.py · Notebook · Open in Colab
Before running a downloaded copy, scan it: uvx bandit -q -t B102,B307,B602,B605 cluster.py (B102,B307,B602,B605 are the exec, eval and shell checks of bandit) reports nothing: the script runs no shell command and evaluates no generated code.
One cell per block of the script: the code, and what that code printed when it last ran here
"""A cluster of the days of one year at Krems an der Donau: a subset of
similar data points, and the three ways a clustering method represents it.

Purpose
-------
Numerical companion to the glossary entry 'cluster'.  The 366 days of
2024 at Krems are data points with the feature vector (morning minimum
temperature, maximum daytime temperature).  A cluster is a subset of
these days that are more similar to each other than to the days outside
the subset, similarity being measured by the Euclidean distance between
feature vectors.

The demo checks the entry's claims on the two clusters of cold and warm
days: the two clusters partition the days, and two days of the same
cluster are closer on average than a cold and a warm day; a cluster
centroid represents a cluster as the set of days nearer to it than to the
other centroid, a half-plane bounded by a straight line; a Gaussian
mixture model represents a cluster by a multivariate normal distribution
whose level sets are elongated ellipses, and assigns every day a degree
of belonging to each cluster; a similarity graph (here the 10-nearest-
neighbor graph of the days) represents a cluster as a densely connected
subset of nodes, which the two clusters are and a split of the days by
their index is not.

Deterministic: k-means starts from the means of the colder and the
warmer half of the days, and the EM algorithm starts from its solution.  Self-contained: numpy + matplotlib only; the GeoSphere
download falls back to the committed CSV.

Blocks
------
[B-data]      Download the daily minimum and maximum temperature of 2024
              at Krems (GeoSphere station 3805) or read the committed
              copy; 366 days, no missing value.
[B-subset]    The two clusters of k-means as subsets of the days: a
              partition into 192 cold and 174 warm days; the average
              distance between two days of one cluster against the
              average distance between a cold and a warm day; the
              nearest other day of almost every day is in its cluster.
[B-centroid]  The cluster as the set of days nearer to its centroid: the
              boundary between the two clusters is the straight line
              through the midpoint of the centroids, at a right angle
              to their connecting segment.
[B-gmm]       The cluster as a multivariate normal distribution: the EM
              algorithm never lowers the log-likelihood, the degrees of
              belonging of a day sum to one, the level sets of the two
              distributions are ellipses elongated along the direction
              in which both temperatures rise, and the days shared
              between the clusters.
[B-graph]     The cluster as a densely connected subset of the nodes of
              the 10-nearest-neighbor graph of the days: the fraction of
              edges inside the two clusters and the ratio cut of the
              clusters against that of the odd/even split of the days.
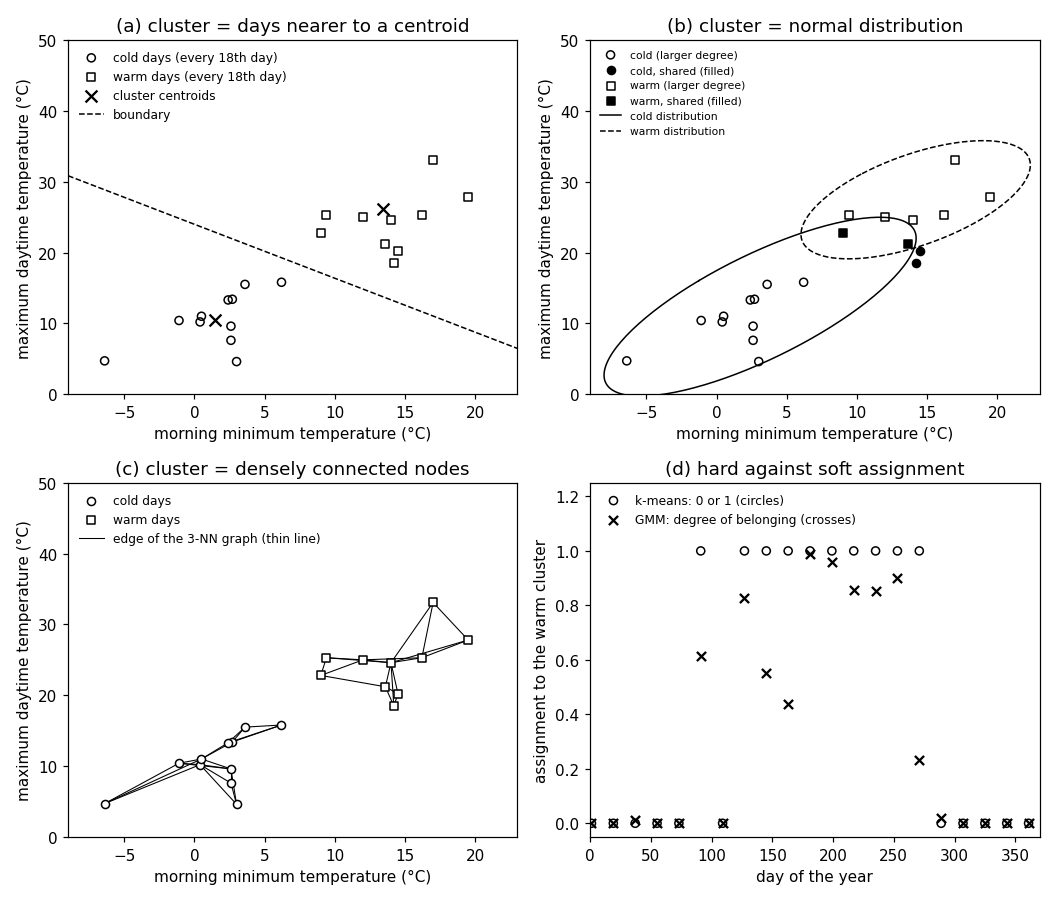
[B-plot]      Every 18th day for the figure (21 of 366 days) with its
              day of the year, cluster and degree of belonging, the
              centroids, the boundary line, the two ellipses, and the
              3-nearest-neighbor graph of the 21 drawn days.

Outputs
-------
cluster_weather.csv       : date, tmin, tmax (committed copy).
cluster_points_plot.csv   : the 21 drawn days with cluster, degree of
                            belonging to the warm cluster, shared flag.
cluster_centroids.csv     : the two cluster centroids.
cluster_boundary.csv      : two end points of the boundary line.
cluster_ellipse_cold.csv  : level set of the cold cluster's distribution.
cluster_ellipse_warm.csv  : level set of the warm cluster's distribution.
cluster_edges_plot.csv    : edges of the 3-NN graph of the 21 drawn days
                            as segments (tmin, tmax, u, v) with a flag
                            for an edge between the two clusters.
cluster.png               : matplotlib preview (checking only).
"""

# /// script
# requires-python = ">=3.10"
# dependencies = ["matplotlib==3.10.7", "numpy==2.3.4"]
# ///

import json
import urllib.request
from pathlib import Path

import numpy as np
import matplotlib

matplotlib.use("Agg")
import matplotlib.pyplot as plt

OUT_DIR = Path(__file__).parent

report = []


def check(name, ok):
    report.append((name, bool(ok)))
    print(f"  [{'ok' if ok else 'FAIL'}] {name}")
Download the daily minimum and maximum temperature of 2024 at Krems (GeoSphere station 3805) or read the committed copy; 366 days, no missing value.
print("[B-data] daily minimum and maximum temperature at Krems, 2024")
URL = ("https://dataset.api.hub.geosphere.at/v1/station/historical/"
       "klima-v2-1d?parameters=tlmin,tlmax&station_ids=3805"
       "&start=2024-01-01&end=2024-12-31")
CSV = OUT_DIR / "cluster_weather.csv"
try:
    with urllib.request.urlopen(URL, timeout=120) as resp:
        payload = json.load(resp)
    params = payload["features"][0]["properties"]["parameters"]
    records = [(stamp[:10], lo, hi)
               for stamp, lo, hi in zip(payload["timestamps"],
                                        params["tlmin"]["data"],
                                        params["tlmax"]["data"])]
    with open(CSV, "w") as fh:
        fh.write("date,tmin,tmax\n")
        for day, lo, hi in records:
            fh.write(f"{day},{lo},{hi}\n")
    print(f"    downloaded {len(records)} days")
except OSError as err:
    print(f"    download failed ({err}); reading the committed CSV")
    rows = CSV.read_text().strip().splitlines()[1:]
    records = [(d, float(a), float(b))
               for d, a, b in (r.split(",") for r in rows)]

check("[B-data] 366 days for 2024", len(records) == 366)
check("[B-data] no day is missing a temperature",
      all(lo is not None and hi is not None for _, lo, hi in records))
X = np.array([[lo, hi] for _, lo, hi in records], dtype=float)
m = len(X)
months = np.array([int(d[5:7]) for d, _, _ in records])


def pairwise_distances(A, B):
    """Euclidean distances between the rows of A and the rows of B."""
    return np.sqrt(np.sum((A[:, None, :] - B[None, :, :]) ** 2, axis=-1))


def assign(X, W):
    """Index of the nearest centroid for every data point."""
    return np.argmin(pairwise_distances(X, W), axis=1)


def lloyd(X, W0, max_iter=500):
    """k-means (alternating assignment and averaging) from the centroids
    W0."""
    W = np.array(W0, dtype=float)
    c = assign(X, W)
    for _ in range(max_iter):
        W = np.array([X[c == j].mean(axis=0) for j in range(len(W))])
        c_new = assign(X, W)
        if np.array_equal(c_new, c):
            break
        c = c_new
    return W, c
[B-data] daily minimum and maximum temperature at Krems, 2024
    downloaded 366 days
  [ok] [B-data] 366 days for 2024
  [ok] [B-data] no day is missing a temperature
The two clusters of k-means as subsets of the days: a partition into 192 cold and 174 warm days; the average distance between two days of one cluster against the average distance between a cold and a warm day; the nearest other day of almost every day is in its cluster.
print("[B-subset] the two clusters of k-means as subsets of the days")
order = np.argsort(X[:, 0])
W0 = np.array([X[order[: m // 2]].mean(axis=0), X[order[m // 2:]].mean(axis=0)])
W, c = lloyd(X, W0)
cold, warm = sorted(range(2), key=lambda j: W[j, 1])
C_cold = np.flatnonzero(c == cold)
C_warm = np.flatnonzero(c == warm)
check(f"[B-subset] the two clusters partition the days: {len(C_cold)} cold "
      f"and {len(C_warm)} warm days, none in both, none in neither",
      len(C_cold) + len(C_warm) == m
      and len(np.intersect1d(C_cold, C_warm)) == 0)
check("[B-subset] every January and February day is a cold day, every "
      "July and August day a warm day",
      np.all(c[np.isin(months, [1, 2])] == cold)
      and np.all(c[np.isin(months, [7, 8])] == warm))
D = pairwise_distances(X, X)
off = ~np.eye(m, dtype=bool)
within = np.concatenate([D[np.ix_(C_cold, C_cold)][off[: len(C_cold),
                                                       : len(C_cold)]],
                         D[np.ix_(C_warm, C_warm)][off[: len(C_warm),
                                                       : len(C_warm)]]])
between = D[np.ix_(C_cold, C_warm)].ravel()
d_within, d_between = within.mean(), between.mean()
check(f"[B-subset] two days of one cluster are {d_within:.1f} degrees "
      f"apart on average, a cold and a warm day {d_between:.1f}",
      d_within < d_between / 2)
D_self = D + np.diag(np.full(m, np.inf))
nn = np.argmin(D_self, axis=1)
same = np.mean(c[nn] == c)
check(f"[B-subset] the nearest other day of {100 * same:.1f}% of the days "
      f"({int(np.sum(c[nn] == c))} of {m}) lies in the same cluster",
      same > 0.95)
[B-subset] the two clusters of k-means as subsets of the days
  [ok] [B-subset] the two clusters partition the days: 192 cold and 174 warm days, none in both, none in neither
  [ok] [B-subset] every January and February day is a cold day, every July and August day a warm day
  [ok] [B-subset] two days of one cluster are 8.0 degrees apart on average, a cold and a warm day 20.2
  [ok] [B-subset] the nearest other day of 99.5% of the days (364 of 366) lies in the same cluster
The cluster as the set of days nearer to its centroid: the boundary between the two clusters is the straight line through the midpoint of the centroids, at a right angle to their connecting segment.
print("[B-centroid] the cluster as the set of days nearer to its centroid")
check("[B-centroid] each centroid is the mean of the days of its cluster",
      all(np.allclose(W[j], X[c == j].mean(axis=0)) for j in range(2)))
check(f"[B-centroid] cold centroid ({W[cold, 0]:.1f}, {W[cold, 1]:.1f}), "
      f"warm centroid ({W[warm, 0]:.1f}, {W[warm, 1]:.1f}); every day lies "
      "in the cluster of its nearer centroid",
      np.array_equal(assign(X, W), c))
mid = (W[cold] + W[warm]) / 2
direction = W[warm] - W[cold]
side = (X - mid) @ direction
check("[B-centroid] the boundary is the straight line through the midpoint "
      "of the centroids at a right angle to their segment: a day is warm "
      "exactly when it lies on the warm side of that line",
      np.array_equal(side > 0, c == warm))
perp = np.array([-direction[1], direction[0]])
perp = perp / np.linalg.norm(perp)
XMIN, XMAX = -9.0, 23.0
t_lo = (XMIN - mid[0]) / perp[0]
t_hi = (XMAX - mid[0]) / perp[0]
boundary = np.array([mid + t_lo * perp, mid + t_hi * perp])
[B-centroid] the cluster as the set of days nearer to its centroid
  [ok] [B-centroid] each centroid is the mean of the days of its cluster
  [ok] [B-centroid] cold centroid (1.5, 10.5), warm centroid (13.4, 26.1); every day lies in the cluster of its nearer centroid
  [ok] [B-centroid] the boundary is the straight line through the midpoint of the centroids at a right angle to their segment: a day is warm exactly when it lies on the warm side of that line
The cluster as a multivariate normal distribution: the EM algorithm never lowers the log-likelihood, the degrees of belonging of a day sum to one, the level sets of the two distributions are ellipses elongated along the direction in which both temperatures rise, and the days shared between the clusters.
print("[B-gmm] the cluster as a multivariate normal distribution")


def mvn_pdf(X, mu, S):
    d = X - mu
    Si = np.linalg.inv(S)
    q = np.einsum("ij,jk,ik->i", d, Si, d)
    return np.exp(-0.5 * q) / (2 * np.pi * np.sqrt(np.linalg.det(S)))


def em(X, mu, S, p, iters=300):
    """EM for a two-component GMM; returns the parameters, the degrees of
    belonging, and the log-likelihood after every iteration."""
    loglik = []
    for _ in range(iters):
        dens = np.stack([p[j] * mvn_pdf(X, mu[j], S[j]) for j in range(2)],
                        axis=1)
        loglik.append(float(np.sum(np.log(dens.sum(axis=1)))))
        U = dens / dens.sum(axis=1, keepdims=True)
        nk = U.sum(axis=0)
        p = nk / len(X)
        mu = (U.T @ X) / nk[:, None]
        S = np.array([((U[:, j, None] * (X - mu[j])).T @ (X - mu[j])) / nk[j]
                      for j in range(2)])
    return mu, S, p, U, loglik


mu0 = W.copy()
S0 = np.array([np.cov(X[c == j].T) for j in range(2)])
p0 = np.array([np.mean(c == j) for j in range(2)])
mu, S, p, U, loglik = em(X, mu0, S0, p0)
check(f"[B-gmm] the EM algorithm never lowers the log-likelihood over "
      f"{len(loglik) - 1} steps ({loglik[0]:.1f} -> {loglik[-1]:.1f})",
      all(b >= a - 1e-6 for a, b in zip(loglik, loglik[1:])))
check("[B-gmm] the two degrees of belonging of every day are nonnegative "
      "and sum to one",
      np.all(U >= 0) and np.allclose(U.sum(axis=1), 1.0))
axes = {}
for j, name in ((cold, "cold"), (warm, "warm")):
    ev, evec = np.linalg.eigh(S[j])
    long_axis = evec[:, 1]
    angle = np.degrees(np.arctan2(abs(long_axis[1]), abs(long_axis[0])))
    axes[name] = (np.sqrt(ev[1]) / np.sqrt(ev[0]), angle, ev, evec)
check(f"[B-gmm] the level sets are ellipses: long axis over short axis "
      f"{axes['cold'][0]:.1f} (cold) and {axes['warm'][0]:.1f} (warm), both "
      f"tilted by {axes['cold'][1]:.0f} and {axes['warm'][1]:.0f} degrees, so "
      "both temperatures rise together along the long axis",
      all(a[0] > 1.5 and 30 < a[1] < 60 for a in axes.values()))
check(f"[B-gmm] means ({mu[cold, 0]:.1f}, {mu[cold, 1]:.1f}) and "
      f"({mu[warm, 0]:.1f}, {mu[warm, 1]:.1f}) differ from the centroids",
      not np.allclose(mu, W, atol=0.5))
u_warm = U[:, warm]
shared = (u_warm > 0.2) & (u_warm < 0.8)
n_shared = int(np.sum(shared))
check(f"[B-gmm] {n_shared} of the {m} days have a degree of belonging "
      "between 0.2 and 0.8 to both clusters", 20 < n_shared < 120)
g = np.where(u_warm > 0.5, warm, cold)
agree = np.mean(g == c)
check(f"[B-gmm] the larger degree of belonging names the k-means cluster "
      f"on {100 * agree:.1f}% of the days ({int(np.sum(g == c))} of {m})",
      agree > 0.85)
n_certain = int(np.sum((u_warm < 0.01) | (u_warm > 0.99)))
print(f"    {n_certain} days have a degree of belonging below 0.01 or "
      "above 0.99")
shared_months = sorted(set(months[shared].tolist()))
check(f"[B-gmm] the shared days fall in the months {shared_months}: none "
      "from November to February",
      not np.any(np.isin(months[shared], [11, 12, 1, 2])))
t = np.linspace(0, 2 * np.pi, 181)
ellipses = {}
for j, name in ((cold, "cold"), (warm, "warm")):
    ev, evec = axes[name][2], axes[name][3]
    circ = np.stack([np.cos(t), np.sin(t)])
    ellipses[name] = (mu[j][:, None] + evec @ (2 * np.sqrt(ev)[:, None]
                                               * circ)).T
[B-gmm] the cluster as a multivariate normal distribution
  [ok] [B-gmm] the EM algorithm never lowers the log-likelihood over 299 steps (-2291.6 -> -2286.3)
  [ok] [B-gmm] the two degrees of belonging of every day are nonnegative and sum to one
  [ok] [B-gmm] the level sets are ellipses: long axis over short axis 2.8 (cold) and 2.0 (warm), both tilted by 50 and 46 degrees, so both temperatures rise together along the long axis
  [ok] [B-gmm] means (3.1, 12.4) and (14.2, 27.5) differ from the centroids
  [ok] [B-gmm] 58 of the 366 days have a degree of belonging between 0.2 and 0.8 to both clusters
  [ok] [B-gmm] the larger degree of belonging names the k-means cluster on 91.5% of the days (335 of 366)
    156 days have a degree of belonging below 0.01 or above 0.99
  [ok] [B-gmm] the shared days fall in the months [3, 4, 5, 6, 7, 8, 9, 10]: none from November to February
The cluster as a densely connected subset of the nodes of the 10-nearest-neighbor graph of the days: the fraction of edges inside the two clusters and the ratio cut of the clusters against that of the odd/even split of the days.
print("[B-graph] the cluster as a densely connected subset of the nodes of "
      "the 10-nearest-neighbor graph")
K_NN = 10
nbrs = np.argsort(D_self, axis=1)[:, :K_NN]
A = np.zeros((m, m), dtype=int)
for i in range(m):
    A[i, nbrs[i]] = 1
A = np.maximum(A, A.T)
n_edges = int(A.sum() // 2)
inside = int(A[np.ix_(C_cold, C_cold)].sum() // 2
             + A[np.ix_(C_warm, C_warm)].sum() // 2)
crossing = n_edges - inside
check(f"[B-graph] the graph has {n_edges} edges; {inside} of them "
      f"({100 * inside / n_edges:.1f}%) join two days of the same cluster "
      f"and {crossing} join a cold with a warm day",
      inside / n_edges > 0.9)


def ratio_cut(A, part):
    """Sum over the two subsets of the cut weight divided by the size."""
    total = 0.0
    for sub in (part, ~part):
        total += A[np.ix_(sub, ~sub)].sum() / sub.sum()
    return float(total)


rc_cluster = ratio_cut(A, c == warm)
rc_index = ratio_cut(A, np.arange(m) % 2 == 1)
check(f"[B-graph] ratio cut {rc_cluster:.2f} for the two clusters against "
      f"{rc_index:.2f} for the split into odd and even days",
      rc_cluster < rc_index / 10)
seen = np.zeros(m, dtype=bool)
n_comp = 0
for s in range(m):
    if seen[s]:
        continue
    n_comp += 1
    stack = [s]
    seen[s] = True
    while stack:
        i = stack.pop()
        for j in np.flatnonzero(A[i]):
            if not seen[j]:
                seen[j] = True
                stack.append(j)
print(f"    the graph has {n_comp} connected component(s)")
[B-graph] the cluster as a densely connected subset of the nodes of the 10-nearest-neighbor graph
  [ok] [B-graph] the graph has 2209 edges; 2174 of them (98.4%) join two days of the same cluster and 35 join a cold with a warm day
  [ok] [B-graph] ratio cut 0.38 for the two clusters against 12.07 for the split into odd and even days
    the graph has 1 connected component(s)
Every 18th day for the figure (21 of 366 days) with its day of the year, cluster and degree of belonging, the centroids, the boundary line, the two ellipses, and the 3-nearest-neighbor graph of the 21 drawn days.
print("[B-plot] thinned scatter, centroids, boundary, ellipses, graph")
idx = np.arange(0, m, 18)
check(f"[B-plot] every 18th day: {len(idx)} of the {m} days are drawn",
      len(idx) == 21)
with open(OUT_DIR / "cluster_points_plot.csv", "w") as fh:
    fh.write("doy,tmin,tmax,cluster,dobwarm,shared,gcluster\n")
    for i in idx:
        fh.write(f"{i + 1},{X[i, 0]:.1f},{X[i, 1]:.1f},{int(c[i] == warm)},"
                 f"{u_warm[i]:.3f},{int(shared[i])},{int(g[i] == warm)}\n")
with open(OUT_DIR / "cluster_centroids.csv", "w") as fh:
    fh.write("tmin,tmax,cluster\n")
    for j in (cold, warm):
        fh.write(f"{W[j, 0]:.4f},{W[j, 1]:.4f},{int(j == warm)}\n")
with open(OUT_DIR / "cluster_boundary.csv", "w") as fh:
    fh.write("tmin,tmax\n")
    for pt in boundary:
        fh.write(f"{pt[0]:.4f},{pt[1]:.4f}\n")
for name in ("cold", "warm"):
    with open(OUT_DIR / f"cluster_ellipse_{name}.csv", "w") as fh:
        fh.write("tmin,tmax\n")
        for pt in ellipses[name]:
            fh.write(f"{pt[0]:.4f},{pt[1]:.4f}\n")
Xp = X[idx]
Dp = pairwise_distances(Xp, Xp) + np.diag(np.full(len(idx), np.inf))
nb3 = np.argsort(Dp, axis=1)[:, :3]
Ap = np.zeros((len(idx), len(idx)), dtype=int)
for i in range(len(idx)):
    Ap[i, nb3[i]] = 1
Ap = np.maximum(Ap, Ap.T)
edges_plot = [(i, j) for i in range(len(idx)) for j in range(i + 1, len(idx))
              if Ap[i, j]]
n_cross_plot = sum(int(c[idx[i]] != c[idx[j]]) for i, j in edges_plot)
check(f"[B-plot] the 3-nearest-neighbor graph of the 21 drawn days has "
      f"{len(edges_plot)} edges, {n_cross_plot} of them between the clusters",
      n_cross_plot <= 3)
with open(OUT_DIR / "cluster_edges_plot.csv", "w") as fh:
    fh.write("tmin,tmax,u,v,cross\n")
    for i, j in edges_plot:
        fh.write(f"{Xp[i, 0]:.1f},{Xp[i, 1]:.1f},"
                 f"{Xp[j, 0] - Xp[i, 0]:.1f},{Xp[j, 1] - Xp[i, 1]:.1f},"
                 f"{int(c[idx[i]] != c[idx[j]])}\n")

fig, ((ax1, ax2), (ax3, ax4)) = plt.subplots(2, 2, figsize=(9.6, 8.2))
for ax in (ax1, ax2, ax3):
    ax.set_xlim(XMIN, XMAX)
    ax.set_ylim(0, 50)
# (a) centroid representation
ax1.set_xlabel("morning minimum temperature (°C)")
ax1.set_ylabel("maximum daytime temperature (°C)")
for j, mk, lab in ((cold, "o", "cold days"), (warm, "s", "warm days")):
    sel = idx[c[idx] == j]
    ax1.scatter(X[sel, 0], X[sel, 1], marker=mk, facecolors="none",
                edgecolors="black", s=28, label=f"{lab} (every 18th day)")
ax1.scatter(W[:, 0], W[:, 1], marker="x", color="black", s=60,
            label="cluster centroids")
ax1.plot(boundary[:, 0], boundary[:, 1], "k--", lw=1, label="boundary")
ax1.set_title("(a) cluster = days nearer to a centroid")
ax1.legend(frameon=False, fontsize=8, loc="upper left")
# (b) distribution representation
ax2.set_xlabel("morning minimum temperature (°C)")
ax2.set_ylabel("maximum daytime temperature (°C)")
for j, mk, lab in ((cold, "o", "cold"), (warm, "s", "warm")):
    sel = idx[(g[idx] == j) & ~shared[idx]]
    ax2.scatter(X[sel, 0], X[sel, 1], marker=mk, facecolors="none",
                edgecolors="black", s=28, label=f"{lab} (larger degree)")
    sel = idx[(g[idx] == j) & shared[idx]]
    ax2.scatter(X[sel, 0], X[sel, 1], marker=mk, color="black", s=28,
                label=f"{lab}, shared (filled)")
ax2.plot(ellipses["cold"][:, 0], ellipses["cold"][:, 1], "k-", lw=1,
         label="cold distribution")
ax2.plot(ellipses["warm"][:, 0], ellipses["warm"][:, 1], "k--", lw=1,
         label="warm distribution")
ax2.set_title("(b) cluster = normal distribution")
ax2.legend(frameon=False, fontsize=7, loc="upper left")
# (c) graph representation
ax3.set_xlabel("morning minimum temperature (°C)")
ax3.set_ylabel("maximum daytime temperature (°C)")
for i, j in edges_plot:
    style = "k--" if c[idx[i]] != c[idx[j]] else "k-"
    ax3.plot([Xp[i, 0], Xp[j, 0]], [Xp[i, 1], Xp[j, 1]], style, lw=0.7)
for j, mk, lab in ((cold, "o", "cold days"), (warm, "s", "warm days")):
    sel = idx[c[idx] == j]
    ax3.scatter(X[sel, 0], X[sel, 1], marker=mk, facecolors="white",
                edgecolors="black", s=28, zorder=3, label=lab)
ax3.plot([], [], "k-", lw=0.7, label="edge of the 3-NN graph (thin line)")
ax3.set_title("(c) cluster = densely connected nodes")
ax3.legend(frameon=False, fontsize=8, loc="upper left")
# (d) hard against soft assignment over the year
ax4.set_xlabel("day of the year")
ax4.set_ylabel("assignment to the warm cluster")
ax4.scatter(idx + 1, (c[idx] == warm).astype(float), marker="o",
            facecolors="none", edgecolors="black", s=28,
            label="k-means: 0 or 1 (circles)")
ax4.scatter(idx + 1, u_warm[idx], marker="x", color="black", s=36,
            label="GMM: degree of belonging (crosses)")
ax4.set_xlim(0, 370)
ax4.set_ylim(-0.05, 1.25)
ax4.set_title("(d) hard against soft assignment")
ax4.legend(frameon=False, fontsize=8, loc="upper left")
fig.tight_layout()
fig.savefig(OUT_DIR / "cluster.png", dpi=110)

n_ok = sum(ok for _, ok in report)
print(f"\n{n_ok}/{len(report)} checks pass")
if n_ok != len(report):
    raise SystemExit(1)
[B-plot] thinned scatter, centroids, boundary, ellipses, graph
  [ok] [B-plot] every 18th day: 21 of the 366 days are drawn
  [ok] [B-plot] the 3-nearest-neighbor graph of the 21 drawn days has 41 edges, 0 of them between the clusters

20/20 checks pass
B-plot writes when the script runs